
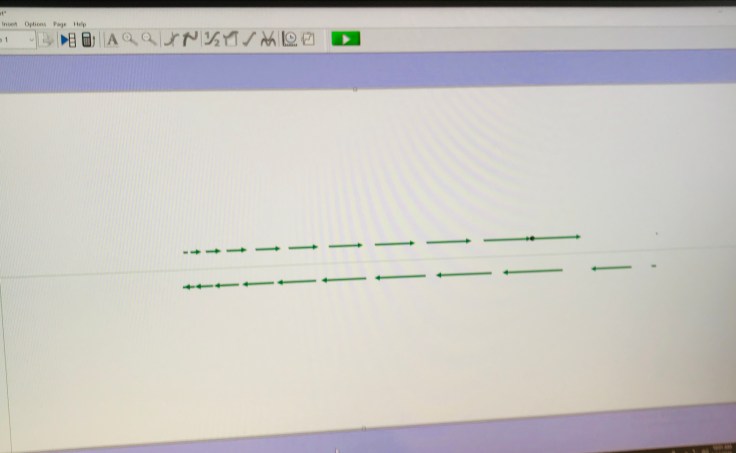
A lesser known function in Logger Pro is Animated Displays, which can be used to do a variety of things. One specific thing it can do is make animated motion diagrams from motion detector data. Below is one that I made for a cart given a quick push up a ramp, and then allowed to slow down before speeding back up the other way.
To get started, you will need to insert an animated display while you have a motion detector connected.

Then, on the screen double click the new display that has appeared. This will open up an options menu.
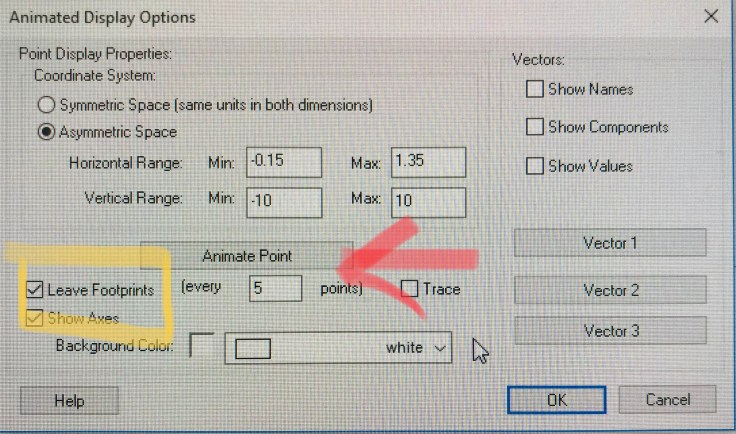
For scaling the display, you will probably want to select asymmetric coordinate systems so you can set the x (or y) axis to match the range of positions the motion detector will be sensing.
Then, you will also want to select “leave foot prints”. You can adjust how often a foot print is left.
Now you want to tell Logger Pro to link the animated point to the data coming from the motion detector. click the animate point button. This should open a window 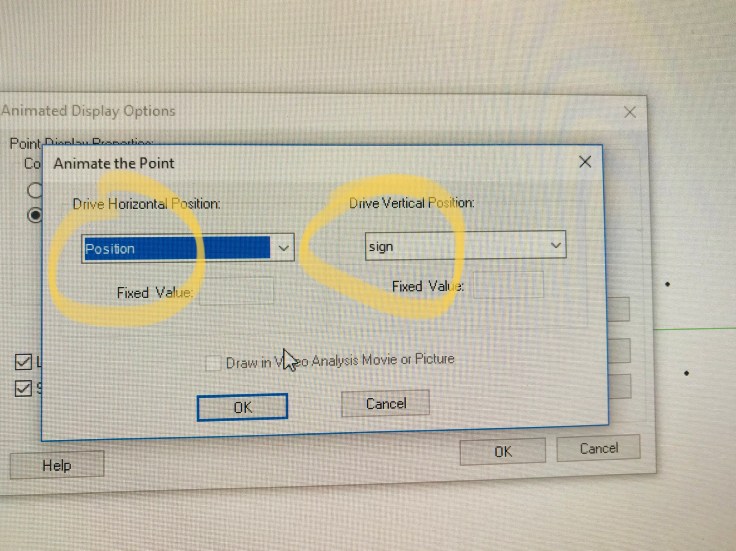
Here you can set the horizontal and vertical variables. Set the horizontal drive to the position variable (this is name of the position data coming from the detector.) Doing this creates a dot on the display at the current value of the motion detector– and thus it animates the motion seen by the motion detector. The leave foot prints is what leaves a “breadcrumb” trail of this animation.
You can leave the vertical drive blank, but I’ll quickly show you how you can offset left motion from the right motion so motion that turns around doesn’t overlap with itself. I do this with a new calculated column that keeps track of whether object is moving in the + or – direction. I call this calculated column “sign” and is defined as
v / |v| (Velocity divide by its absolute value)
This will give a value of + 1 or – 1. By setting the vertical drive to this “sign” variable, motion in the positive direction will be plotted slightly above the axes and motion in the negative direction will be offset below. With an offset of +/- 1, a vertical range of +/- 10 seems to look decent.
Here is what the calculated column definition looks like.

Either way, whether you offset or not, you can also choose to add velocity vectors back once you are back at the display options menu. At the animated display options menu, click one of the vector buttons. This should open up a window where you can define a vector.

To give the motion diagram vectors. Set the horizontal component to track the velocity. You may need to adjust the scale down.
Anyway, you can also add acceleration vectors through a similar method, but it can’t get a little clunky on the screen if you aren’t careful about scale sizes for the motion you are observing.
Anyway, that’s the gist.
