Constrained Construction Problems

I was motivated during my flight today to come up with physics problems that have multiple right answers, have a low barrier to entry and a high ceiling. Here’s my go at it, along with thoughts.

The idea behind these is students are supposed to come up with as many ways as possible.

1. Draw as many velocity vs time graphs that show an object moving +45m from where it started.

Extend 1: Describe each in words.

Extend 2: Pick one and draw its corresponding position vs time graph.

2. Draw pictures depicting situations where a normal force exerted on an object is different than the objects weight.

Extend 1: Pick one to draw a free-body diagram that will help you to explain your reasoning.

Extend 2: Categorize them by Fn > mg and Fn > mg.

3. Draw a picture of a situation where the initial and final states consist entirely of potential energy.

Extend 1: Draw energy pie charts for the initial and final state and at least two in between.

4. Identify the mass and initial velocities for two objects objects that when they collide, they stick together and remain motionless.

5. Draw free body diagrams for an object that will accelerate at 1 m/s/s.

6. Draw a velocity vs time graphs and categorize them into those that involve an object turning around and those that do not .

Extend 1: Come up with a rule.

Extend 2: Do the same for position vs time.

7. Draw a force that acts on an extended object such that the Torque due to that force is CCW.

Extensions: multiple forces where net torque is…

Brian’s Development Rules of Thumb:

– Situations should involve relationships with wiggle room. For example, consider a = Fnet / m. Not only can Fnet and m vary but the same Fnet can be accomplished in different ways. Torque similarly has wiggle room in location, angle, choice of pivot qualitatively and force, distance, angle quantitatively.

– Design around tasks that get close to known difficulties, but don’t over constrain things to make it narrowly about the difficulty. For example, don’t do, “Negative acceleration and speeding up”. Just do speeding up velocity graphs and see what happens. Or if you are going to go right at difficulties, don’t make it a trick or you being clever. My normal force situation I think tackles a difficulty in a straight forward manner and it may work, because there are do many ways to do this.

– I like processes where initial and end states are constrained but not the process in between. (Energy example above). This provides a large variety.

– I think you want choose representations very deliberately. Perhaps, ask students to start with or move to representations that support semi-quantification, or ask them to extend to multiple representations. I think it’s OK to start with picture, but it’s important to bridge to a representation (Normal and Energy are examples)

– When using in class, I would want to think carefully about the sequence of individual work leading to group work leading to whole class sharing and discussion.

– If I designed the task with a particular issue to come up and it didn’t spontaneously, I would just introduce it and ask students to consider it.

– I think these tasks are very amenable to the Five Practices for Orchestrating Productive Discussions framework. (Link to come on an edit)

Anyway, what do you think? I’m interested in what others would come up with.

Pearson / ActivOnline Physics: Kinematics Simulation Activities

I stumbled across a decent simulation, while I was reading up about ISLE. The simulation can be found here:

http://media.pearsoncmg.com/bc/aw_young_physics_11/pt1a/Media/DescribingMotion/AnalyMotUsingDiag/Main.html

I think these simple kinematics simulations are pretty cool, especially the four problems at end, where you have to adjust the initial position, initial velocity, and initial acceleration to match the motion map. Nothing fancy, but pretty engaging.

Content Learning: It’s a nice bridge between qualitative and quantitative representation of kinematics, supporting mathematical sense-making rather than plug-and-chug approaches. It would likely support students distinguishing between position, velocity, and acceleration. It would also provide students with opportunities to wrestle with the meaning of algebraic sign for each of those quantities.

Pedagogical Affordances: The sequence begins with observations and moves toward application. It’s game-like in a productive way–fun, challenging, easy to jump into and try, and provides immediate feedback. You’d probably just have to help students from mindlessly manipulating values to match the motion.

The full range of simulations, which I haven’t looked at closely is linked here: http://wps.aw.com/aw_young_physics_11/

What is Impulse? Conceptualizations of Cause/Effect, Process/ Change in State, and Momentum Flow

This is not a comprehensive treatment of some complex ideas, but here are some thoughts from today.

I bought myself a copy of Greg Jacob‘s 5 steps to a five to add to our library for pre-service physics teacher. In reading it, I’ve come across a statement that is representative of ontological differences in how physicists think about a few concepts in introductory physics, which I think stems from differences in how one can interpret the equal sign. I don’t have the exact quite, but Greg I think in the text implies that Impulse is both the change in momentum and the product of Net Force and its corresponding time interval.

Impulse = Fnet.Δt = Δp

From this perspective, the equal sign allows one to say that all three things are equally, both quantitatively and ontologically. Impulse is a word for both things.

My thinking about this mathematically is more like

Impulse ≡ F.Δt  We’ll define impulse for a single force to be the product or integral.

Then we we can add up individual impulses, to get the Net impulse ≡ Σ Impulses = Σ F.Δt = Fnet.Δt

By applying Newton’s 2nd law, you get that Fnet.Δt  = Δp.

Thus Net Impulse = Δp

To me, impulses are causal influences that together cause a change in a momentum, which is the effect. So to me, impulse is not change in momentum, not ontologically, because one is the cause and the other is the effect. So, I guess I see two differences, and they may or may not be related. First, I think we can define impulses for individual forces (and I’m not sure what Greg would think), and I also think that impulses are events whereas change in momentum is a change in state. Since I think they are ontologically different, I would never want to say that impulse is a change in momentum.

Of course, you can take such a momentum perspectives even further, such that even static situations involve momentum flow. In this case, individual impulses each actually flow momentum, such that the net momentum flow is zero. That is, in this perspective, it’s taken even further that each impulse (cause) has an effect (momentum) flow and the momentum flows combined to create a net momentum flow. In other words, the mathematical steps above are different, because Newton’s 2nd law is applied first and then the sum is taken.

And of course, similar differences in conceptualizations exist when we think about work, net work, change in kinetic energy, and the product of Force and displacement.

I’m not necessarily convinced that any way of thinking about this is “correct”, but I do think it’s useful to be able to acknowledge and attempt to reconcile the different ways of thinking about it.

People who I suspect will have an opinion on this: Leslie Atkins, Andy Rundquist, Benedikt Harrer, and many others.


Trying to Reflect on What Made a Great Semester So Great

Now that I’ve had some time away from it, I want to try to reflect on what was a truly wonderful class and teaching experience that occurred  in my inquiry / physical science course for elementary education majors this past spring. It was a class where we learned a whole lot together while laughing almost everyday (sometimes very loudly).

The bulk of the course focused around two very different parts of the course.

Part One: 7 weeks of Guided Inquiry using the Physical Science and Everyday Thinking Curriculum (Focused around Energy)

Part Two: 5 weeks of Responsive Inquiry informed by facilitation from Student Generated Scientific Inquiry (Focused around the Moon)

My gut feeling about the class has been that a large part of what made it so great had nothing to do with anything I was doing differently. The story in my head goes: “I just happened to have been lucky with the group of students I had. In terms of individual students I was lucky, but I was also just lucky in terms of the group as a whole. Things just happen to fall into place with the right people.” I think there is a lot of truth to that. My inquiry class can be difficult to navigate for many students, especially those  who are not used to taking responsibility for their own learning, or who have never had to grapple with uncertainty and the unknown for extended periods of time, or are not used to really talking and listening as a way of learning. In the past, I’ve had mixed success, often with usually one or two disgruntled students and usually a varied size of students who embrace the class strongly.

This past semester, the story would merely go that I just happened to have a group of students who, for whatever reason, really found ways and reasons to embrace these experiences. That’s not to say that students were never uncomfortable or frustrated, but their discomfort and frustrations were experiences that occurred within a overall supportive environment rather than being a defining, pervasive aspect of the course. But still,  I’d like to be able to walk away from that experience with more than just, “It was luck. You just have to get the right combination of students.” So I hope hear to reflect on things that I may have done differently.

Guided Inquiry before Open Inquiry: Students had 7 weeks of guided inquiry in which there would be short periods of uncertainty with strong content scaffolding, importantly, before having extended periods of uncertainty with less scaffolding on content and more scaffolding on inquiry. This gave students positive experiences with learning science content which let them dabble in inquiry waters before jumping in. Because I can’t possibly follow the structured curriculum closely, students also got to experience moments of intense unscripted inquiry and responsive whole class discussion. With the class I had explicit discussions about the differences between some of the worksheet science we were doing and the real science we were doing when it occurred more spontaneously. Our class spent a lot of time during our guided inquiry into energy talking about Amy’s pee theory and investigating phenomena (which according to the curriculum should have been homework practice), but instead became rich contexts for extended inquiry. When students didn’t believe a simulation they were investigating, we improvised to do our our experiments to help settle the issue. I think this also meant, in the first part of the course, I could focus on being a good teacher rather than being a curriculum designer/developer.

Structuring the Media that Structured Classroom Discourse: I spent a lot of time this past semester working to craft environments for whole class discussion. In previous classes, I mostly though about the seating arrangements (e.g., tables, circles,etc)  and methods for sharing / collaborating students’ written work (whiteboards, document cameras, etc). This semester my environments for discourse were much more rich and required a to more prep work. For example, when discussing a particular energy representation about a phenomena we couldn’t get consensus on, I cut out big colored arrows, boxes, and circles with labels. Previously, I would have had students do whiteboards and share out or have a whole class discussion while making a consensus diagram at the board. Instead, we had these magnetized manipulatives to move around the board. One at a time students had to come up and add, change, or take away something at the board and give reasons. I did similar thing with Venn Diagrams when comparing students related but different ideas students were struggling with–big Venn Diagrams on the board and words students could put different places. Groups had all the choices to do together, but then each group was given a select portion to put up on the common Venn Diagram. We only talked about the ones that there was disagreement about. When we got to the moon, I spent a whole weekend cutting out 2D and 3D manipulatives, including many of the student-generated representational supports that had been invented in previous semesters. All and all, I spent a lot of time thinking about how to give students just the right balance of constraints and freedom to have meaningful discussion.

Structuring Students’ Writing: Students have always had to do a lot of writing for class, but this time I did a lot more to structure students writing–to give them explicit expectations and feedback. The PSET curriculum already has a strong structured writing component, in which students learn about, practice, and both give and receive feedback on three criteria: completeness, clarity, and consistency. In the responsive more open inquiry unit, students had to read, practice, and give/get feedback related to readings from “They Say/ I Say”.  For their large, original piece of work they had to write about the moon, students had to write about and respond to ideas from class, which really helped students care about and be motivated to keep good records about their peer’s thinking without me having to grade notebooks on such matters. Previously, I had tried to structured students writing, but I never structured in well enough for students to really understand and for me to stick to giving feedback closely to those structures.

Change in Day/Time Structure: The class used to meet 2 days a week (3 hours each meeting) to 3 days a week (2 hours each meeting). I don’t think this is insignificant, both for students and me. For students, three hour twice a week is rough. But for me, planning for 2 hours is much easier than 3 hours. Plus, in a responsive inquiry setting, in which improvisation is often necessary mid-instruction, many more things can go wrong in 3 hours than in 2 hours. You get more chances with three meetings to reflect on what’s happened and plan.

No Attendance Grade (Except for a Participation Self-Assessment): Previously, because being continuously present and participating is so critical to coherence in the classroom (both for individual students and the class), I had an attendance policy. This semester, I just asked students to self-assess their participation along a rubric several times throughout the semester. For the most part, students gave themselves honest assessments. As part of those assessments, they had to give themselves goals for next time and self-evaluate next time with evidence. I can say that participation was about the same as before–pretty good. Before, students felt like I was punishing them for not showing up. Now, students usually felt like they had punished themselves. Students also self-assessed and peer-assessed on their moon journals.

Summary:

I guess it boils down to (1) scaffolding early experiences for success by using a structured curriculum, (2) improving clarity about expectations (especially writing), (3) use of self-assessment and peer-assessment, (4) more thorough preparation for classroom discussions, and (5) more workable timetable / schedule.

I think those things are tangible things I can think about that were different. I’m sure there are lots of less tangible things I may have done in terms of how I interacted with students, but I can’t say for certain. I know my interactions with students were very positive, but the nature of interactions are complicated and can’t be solely attributed to things I did.

Was it all in my head? No, I don’t think so.

So, it wasn’t just me that felt the class was so wonderful. For the most part, evidence suggests that students tremendously valued the time they spent in class. In other classes, I typically get notes from students saying things like, “I admire your professionalism and your passion for your chosen field,” but in my inquiry class this past spring, students wrote things like, “You really are a great friend,” “We love you,” and “Love your guts”.

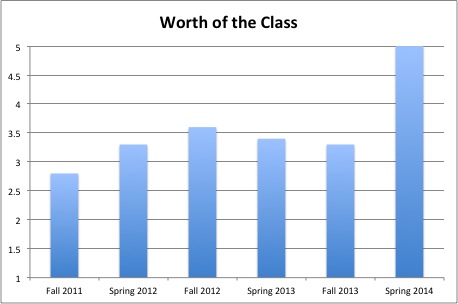
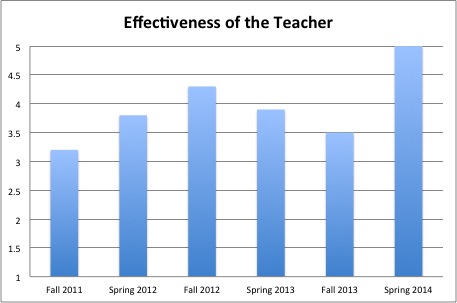
Student evaluations also suggest that students felt like this classroom experience was more worthwhile and effective than previous classes of mine. Two categories that are the very signifying on our evaluations are,”How worthwhile was this course in comparison with other courses you have taken at this university?” and “How would you rate the overall teaching effectiveness of your instructors?” With both of those questions, every student answered those two question as highly as possible. Here are graphs showing trends in this class over the last 3 years.

Effectiveness Worth

The sad ending to this post is that I am likely to not be teaching this class in the near future. The elementary education program here has been declining in enrollments, which has meant that our offerings of the course are now half of what they used to be. I am not slated to teach the class next year. I suppose it’s nice to end on a high note, so there’s that.

PER Standards of Reporting FCI Data: Mixed Results on Recent Papers

My sense has been that the PER community still implement subpar standards of research reporting that minimizes our ability to carry out meaningful meta-analysis. I’m not an expert, but I’m assuming that the scores with standard deviations / standard errors would be necessary for a meta-analysis, right? So I’m curious. I’m going to quickly take a look at some  recent papers that report FCI scores as a major part of their study, and see what kind of information is provided by the authors. Here’s how I’ll break it down.

Raw-(ish) Data:

N = number of students

Pre = FCI pre-score either as raw score out of 30 or a percentage (with or without standard deviation / standard error of mean)

Post = FCI post-score either as a raw score out of 30 or a percentage (with or without standard deviation / standard error of mean)

Calculated Data:

g = normalized gain with or without errors bars / confidence intervals

<G> = average normalized gain with or without errors bars / confidence intervals

Gain = Post minus Pre (with or without standard deviation / standard error of mean)

APost = ANOVCA adjusted post score (with or without standard error of mean)

d = Cohen’s d is a measure of effect size (with or without confidence intervals)

I’m leaving out statistical transparency such t-statistics or p-values, or other measures from ANOVA, and I’m sure there are others, such as accompanying data about gender, under-represented minorities, ACT scores, declared major, etc.

Anyway, here we go:

1. Thacker, Dulli, Pattillo, and West (2014) ,”Lessons from large-scale assessment: Results from conceptual inventories

Raw Data: N

Accompanying Data: None

Calculated Data:  g with standard error of the mean (mostly must be read from graphs)

2. Lasry, Charles and Whittaker, “When teacher-centered instructors are assigned to student-centered classrooms”

Raw Data: N, Pre with standard deviation

Accompanying Data: None

Calculated Data: g with standard error of mean (must be read from graphs), Apost with standard error,

3. Cahill et al: Multiyear, multi-instructor evaluation of a large-class interactive-engagement curriculum

Raw Data: N

Accompanying Data: Gender, major, ACT

Calculated Data: g with standard error of mean (must be read from graphs)

4. Ding: “Verification of causal influences of reasoning skills and epistemology on physics conceptual learning

Raw Data: N, Pre (with standard deviation), Post (with standard deviation),

Accompanying Data:  Others related to study, CLASS, for example

Calculate Data: g with standard error of mean

5. Couch and Mazur: Peer Instruction: Ten years of experience and results”

Raw Data: N, Pre (without standard deviation), PostPre (without standard deviation)

Calculated Data: g (with out standard deviation), d (without confidence intervals)

6. Goertzen et al, “Moving toward change: Institutionalizing reform through implementation of the Learning Assistant model and Open Source Tutorials

Raw Data: N, Pre (with SD), Post (with SD),

Accompanying Data: Gender, race, etc.

Calculated Data: Gain (with SD), d (with CI)

7. Brewe et al, “Toward equity through participation in Modeling Instruction in introductory university physics”

Raw Data: N, pre (with SE), Post (with SE)

Accompanying Data: Gender, majority/minority

Calculated Data: Gain (with SE), d (with CI)

So, what do I see? 

Of my quick grab of 7 recent papers, only 3 papers meet the criteria for reporting the minimum raw data that I would think are necessary to perform meta-analyses. Not coincidentally, two of these three papers are from the same research group. Also, probably not coincidentally, all three papers include data both in graphs and tables and include errors bars or confidence intervals. They also consistently reported measures related to any statistical analyses performed.

Four of the papers did not fully report raw data. One of the four almost gave all the raw information needed, reporting ANCOVA adjusted post scores rather than raw post scores. Even here the pre-score data is buried and Apost and g scores can almost only be gleaned from graphs. Two of the papers did not give raw data about pre or post. They reported normalized gain information with errors bars shown, but they could only be read from a graph. These two papers did some statistical analyses, but didn’t report them fully. The last of the four reported pre and post scores but didn’t include standard error or deviations. They carried out some statistically analysis as well, but did not report it meaningfully or include confidence intervals.

I don’t intend this post to be pointing the finger at anyone, but rather to point out how inconsistent we are. Responsibility is community-wide–authors, reviewers, and editors. My sense looking at these papers, even the ones that didn’t fully report data, is that this is much better than what was historically done in our field. Statistical tests were largely performed, but not necessarily reported out fully. Standard errors were often reported, but often needing to be read from small graphs.

There’s probably a lot some person could dig into with this, but it’s probably not going to be me.


Blog at WordPress.com.

Up ↑