
I am not making it to AAPT or PERC this year, but this is a summary of what I would have liked to share had I been able to go. I’ll start with the abstract I submitted to PERC:
Leveraging FCI–ACT Correlations to Communicate the Impact of Course Reform
Conceptual inventories such as the FCI are widely used to assess the impact of course reform efforts in physics education. Gains on these instruments, however, are known to correlate with other student variables such as students’ SAT score. I make use of this type of underlying correlation to communicate the impact of course reforms to broad audiences outside of physics education for which the FCI is not a useful benchmark. To illustrate this approach, I present an analysis of FCI learning gains that are disaggregated by ACT score before and after a major course reform in an introductory physics course. In this sample, normalized learning gains shifted from 0.28 to 0.46 were found to be equivalent to a shift in average ACT score from 24 to 29. Implications for the communicating research and evaluation results with different audiences are discussed.
Here’s the gist. Whenever we in physics education are trying to communicate the impact of some course reform on student learning, we all have a sense that it is important to consider and understand the audience. Who are you talking to? What do they know? What can they relate to? What are useful ways of articulating impact to them?
So what is this post job about? This post is about how I have recently changed the way I talk about the impact of course reform for folks not strongly connected to physics education.
So, consider the Force Concept Inventory. With this instrument, it is common in the physics education community to talk about the impact on student learning in terms of normalized gain and/or effect size.
- Normalized gain is familiar to a large swath of researchers and teachers in physics education for historical and political reasons. As a result, many physics educators have developed a sense of what different scores might mean in a normative way — How does this compare to “typical” outcome? What does a “good” score look like? What does a “bad” score look like? What range of scores should we be aiming for? That said, normalized gain is not always a useful tool for communicating outside of physics education, and is a tool with some drawbacks in terms of its utility for making scholarly claims.
- Effect sizes (e.g., Cohen’s d) are more likely to be reported by researchers for a variety of reasons that I don’t want to get into here. It will suffice to say that there are fewer drawbacks than normalized gain, and that effect size is a tool better designed for characterizing the degree of “impact”. As such, effect sizes are valuable tool for making scholarly claims and also for communicating with persons outside of physics education. On there other hand, effect sizes have the disadvantage of being less familiar to the broad physics education community.
OK, so there are certainly other ways one might choose to communicate impact of course reforms using the FCI, but I want to keep this discussion focused on just these two, because they are the most common and it will keep the discussion focused.
So what’s the deal? I have personally found that neither normalized gain nor effect size has been very effective for talking with certain audiences, which for me include:
- Physics Faculty, especially those who may be less familiar with (or skeptical) of Physics Education Research
- Administrators
- Faculty and educators from other disciplines
- Education researchers not familiar with physics education or effect sizes.
In this post, I want to introduce a way that I have recently shifted to in talking about the impact of our course reform to certain audiences that I think is quite useful. I will use our recent efforts at course reform at our introductory as an example:
OK, so here is part of the timeline for our course reform efforts:
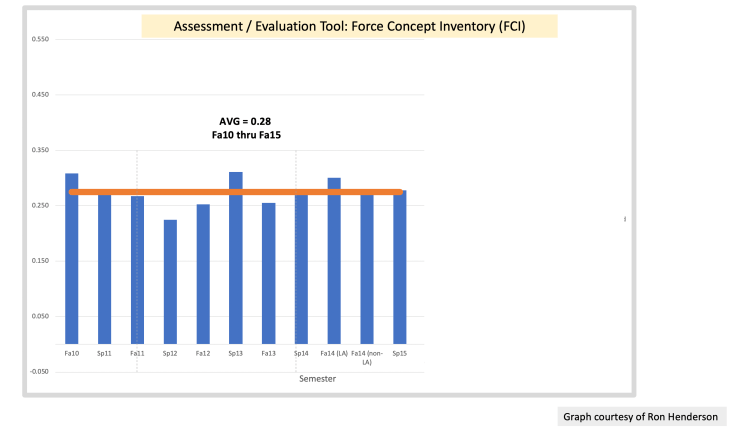
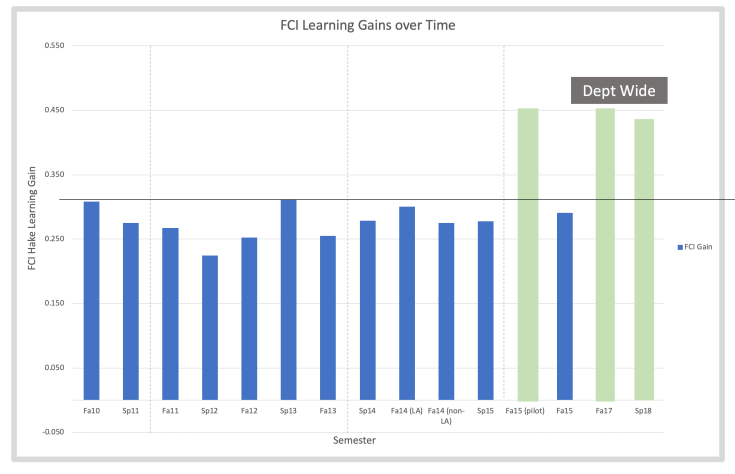
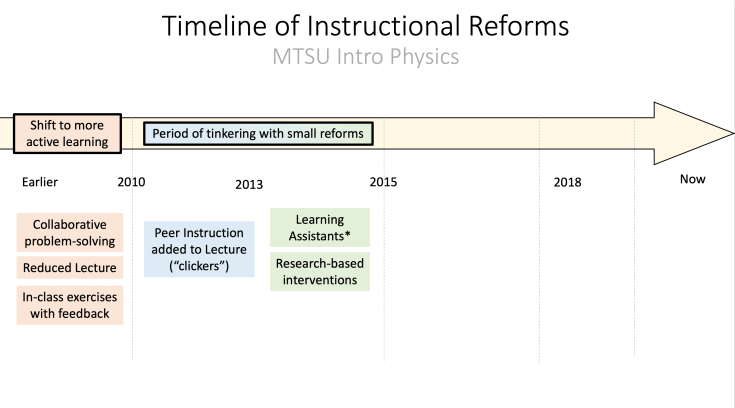 I joined the department in 2011, when active learning was implemented department-wide in our introductory physics courses. Slightly before and in the year following my arrival, our department tinkered with various reforms. Here is what our data looked like in terms of normalized gain.
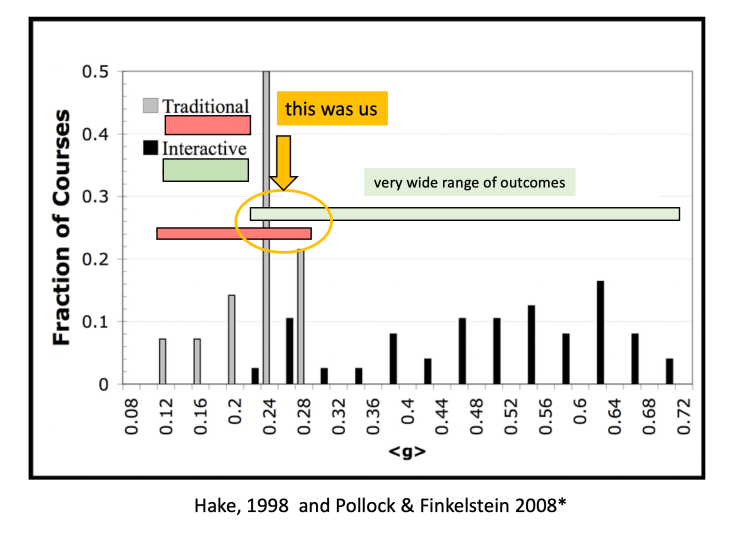
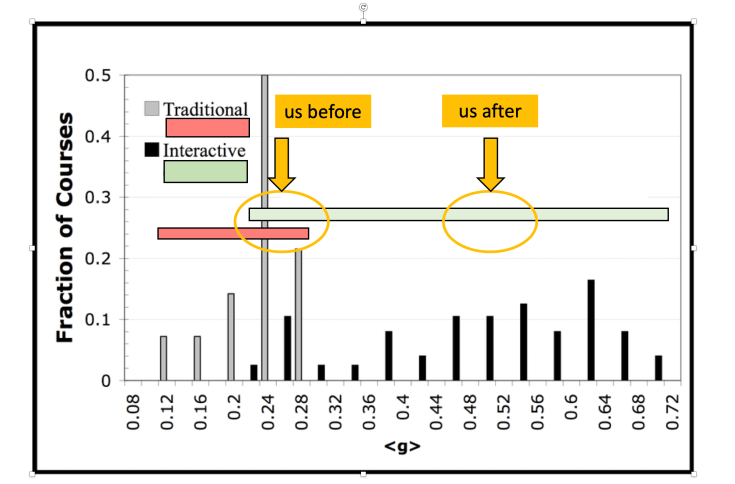
To locate these normalized gain within a comparative landscape, it’s useful to consider our results as compared to typical results.
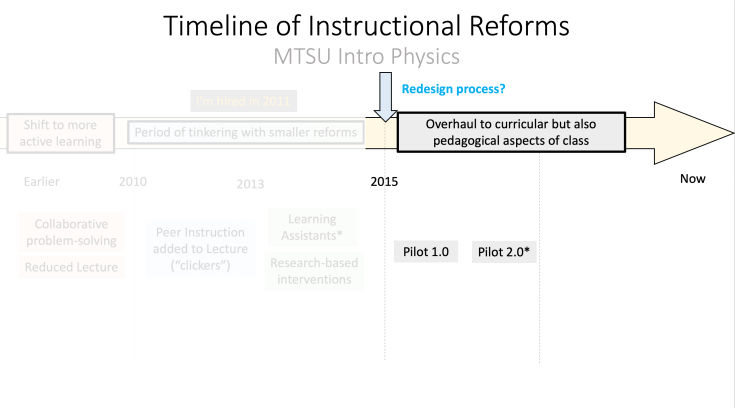
Dissatisfied with these results are more comprehensive overhaul was undertaken
 At the time, we were engaged in the pilot, I had tried communicating the results to my faculty in the following way — showing raw gain, and providing percentages of students who met certain thresholds.
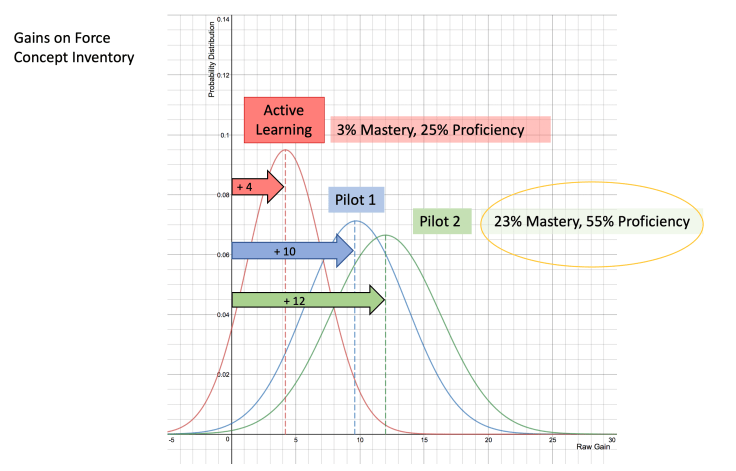
Roughly, these corresponded to normalized gains for the pilot that were 45-55%, which put our results more on the “good” side of the comparative/ normative landscape:
After the pilots, we scaled up the new course to the entire department, and we were able to maintain the gains, which you can see here.
If you are someone in the physics education community, there’s a good chance that I’ve provided sufficient information for you to have a sense of what the outcomes we achieved might mean, even if there’s certainly more you would like to know. This is mostly because, I have focused on using normalized gain as the main lens.
So where to go now? For me, in talking about this with various audiences who are not connected to the physics education community, I have found it useful to translate these results in a different way. To do so, I leverage that fact that normalized gain on the FCI are often correlated with SAT /ACT scores, which I have written about before generally. and also more specifically here.
The basic idea is to disaggregate the data by ACT score. For our reform courses, you get the following graph:
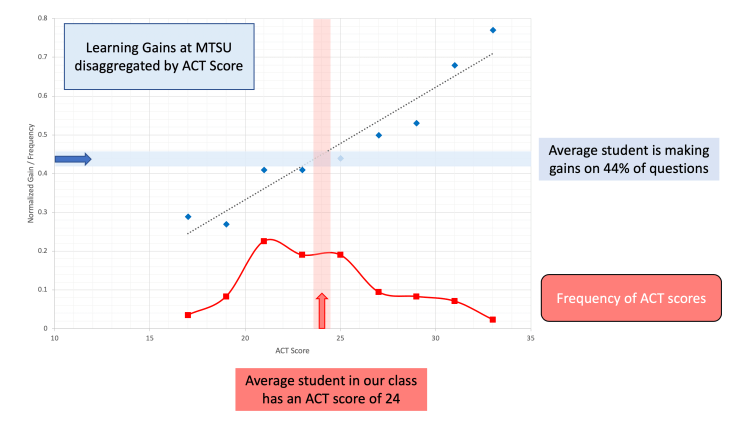
This shows that, on average, students with higher ACT scores end up with higher normalized gains. Our average student has an ACT score of 24, and a learning gain of 44%. Students with ACT scores above 30 tend to achieve learning gains above 65%. Students with ACT scores below 20 tend to below 30%.
If we see similarly disaggregate our data from before the course reform you get the following:
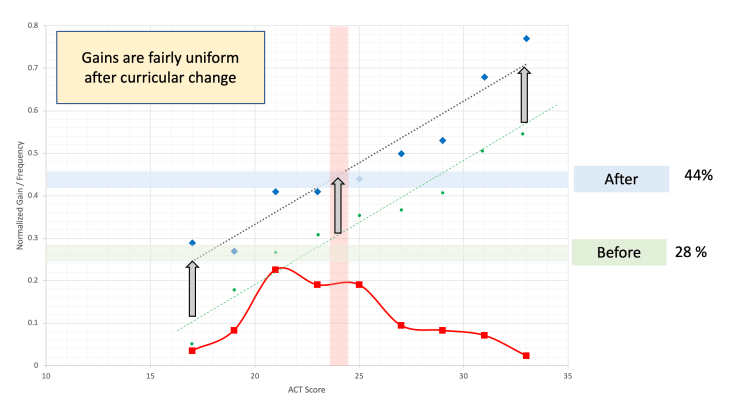
So, the basic gist here is that our new course tended to improve outcomes for everyone, regardless of ACT score, and it tended to increase scores by about the same amount, say about 17% gains.
But there is another way that we could have achieved a similar boost of 17% without making any changes to the course. We could have somehow been more selective about what students we allow to take our course. The question then becomes, how much more selective would we have needed to be?
This is the graph that I have been building up to when I am speaking with audiences that are less familiar with the FCI and physics education.
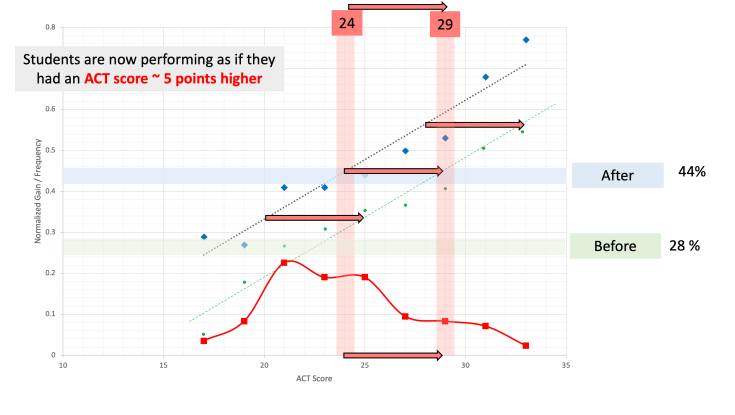
I turns out, that for our course reform efforts, relative to the old course, students are now performing as if they had an ACT score ~ 5 points higher than before. Or, in order to achieve the same result with the old course, we would have needed a population of students with an average close to an ACT of 29.
[For reference, the ACT benchmark score for college readiness across STEM fields is ~ 26, and for biology specifically it is ~23. The average ACT score for students at MTSU is 22 ]
I don’t think what I have done here is a big deal, but I think it’s definitely worth sharing. So, here are some of my take-aways:
First, at my institution, faculty and administrators are much more likely to be familiar with the ACT. Thus, when engaging those audiences, it makes sense for me to translate into a measure related to the ACT. Maybe this will be useful for others?
Second, disaggregating data is really useful, in general. I hope to motivate more physics educators to disaggregate their data in various ways. Beyond what I’ve talked about here, disaggregating your data gives you a much more nuanced view of what’s going on.

Leave a comment