
So, I’m in the very early stages here, both in terms of thinking and development, but here’s my attempt at a problem-solving activity using desmos. I realize that this is focused on very mechanical aspects of problem-solving here (picking knowns and knowns, doing calculations, etc), but I’m just getting started here.
The things I’m trying to capitalize here is on students getting feedback from other students that is helpful (but not too helpful), accessible at the right time (it’s ready for you when you want it), and easy for students to give.
So here’s my not so-great prototype:
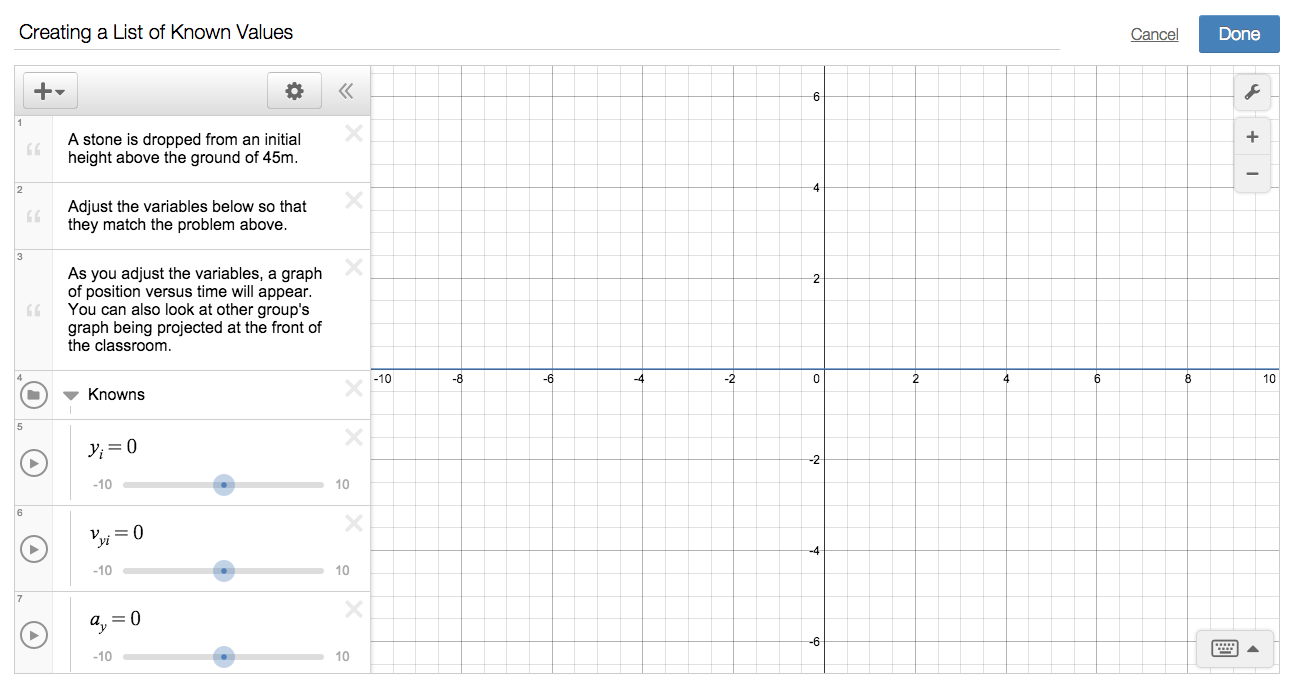
Part 1: Students get a kinematics problem, and they are asked to adjust adjust their known information about the problems using sliders. A graph of position versus time is automatically shown for the values they pick.
Feedback: Projected at the front of the room is an overlay of all students’ graphs. Students get to see the overlay of graphs, (not the values that each group picked).
Students might notice their graph is different than others. Or the teacher might notice that half the class has one graph and half has a different.
Part 2: Students get asked a question. The question students get is, “Explain how your group knew what each of these values should be based on what you know about the stone.”
Feedback: As students write their answers, other group’s answers immediately appear below their own.
Part 3: Students get a new blank graph, and are asked to pick a time and then calculate the position. They enter their time and position in a table, and their point appears on the screen. You might want students to do 2-3 points depending on time and how many groups, or after first point is done to look at the overlay and to pick a point that hasn’t been done yet.

Feedback: Students get to see an overlay of all the points. I’m imagining a couple scenarios: Two students pick the same time, but get different positions. Or their is an obvious outlier to the trend.
Part 4: Students get another question that asks how they went about solving for the position. Students get to see what others students’ said.
So like I said, this isn’t great, but here are some things I like:
- Students get feedback about their known values by how the shape of their graph compares to the shape of their graph (not the values themselves)… [Side: makes me thinking follow up question might be about why shape of graph makes sense for the problem]
- Students get a tiny bit of choice in choosing what time to pick. They get feedback about how their answers compare to others, but it’s not simple as “I got 3. What did you get?” Once again it’s in the graph.
- In having choice and a graph, students might choose to explore interesting questions (negative times, big times).
Some obvious improvements:
- Pick a better problem.
- Ask better follow up questions.
But I’m more wondering about structure. So tell me, what structurally would make this better in terms of student engagement, student interaction, or student feedback? Or tell me why this structure is completely awful, and suggest a totally different structure that would be better. I spent ~10 minutes making the activity file and ~15 minutes writing this blogpost, so I won’t have my feelings hurt.

Leave a comment