")
Yesterday, in my pilot section of revised algebra-based physics, we talked about uncertainty for a bit and then students did the buggy lab. Lab went well. Only change was groups who finished early had to revise/apply their model to make a prediction and test it out (e.g., buggy starting somewhere new, going in opposite direction, where will it be/ or how long will it take to ___ ).
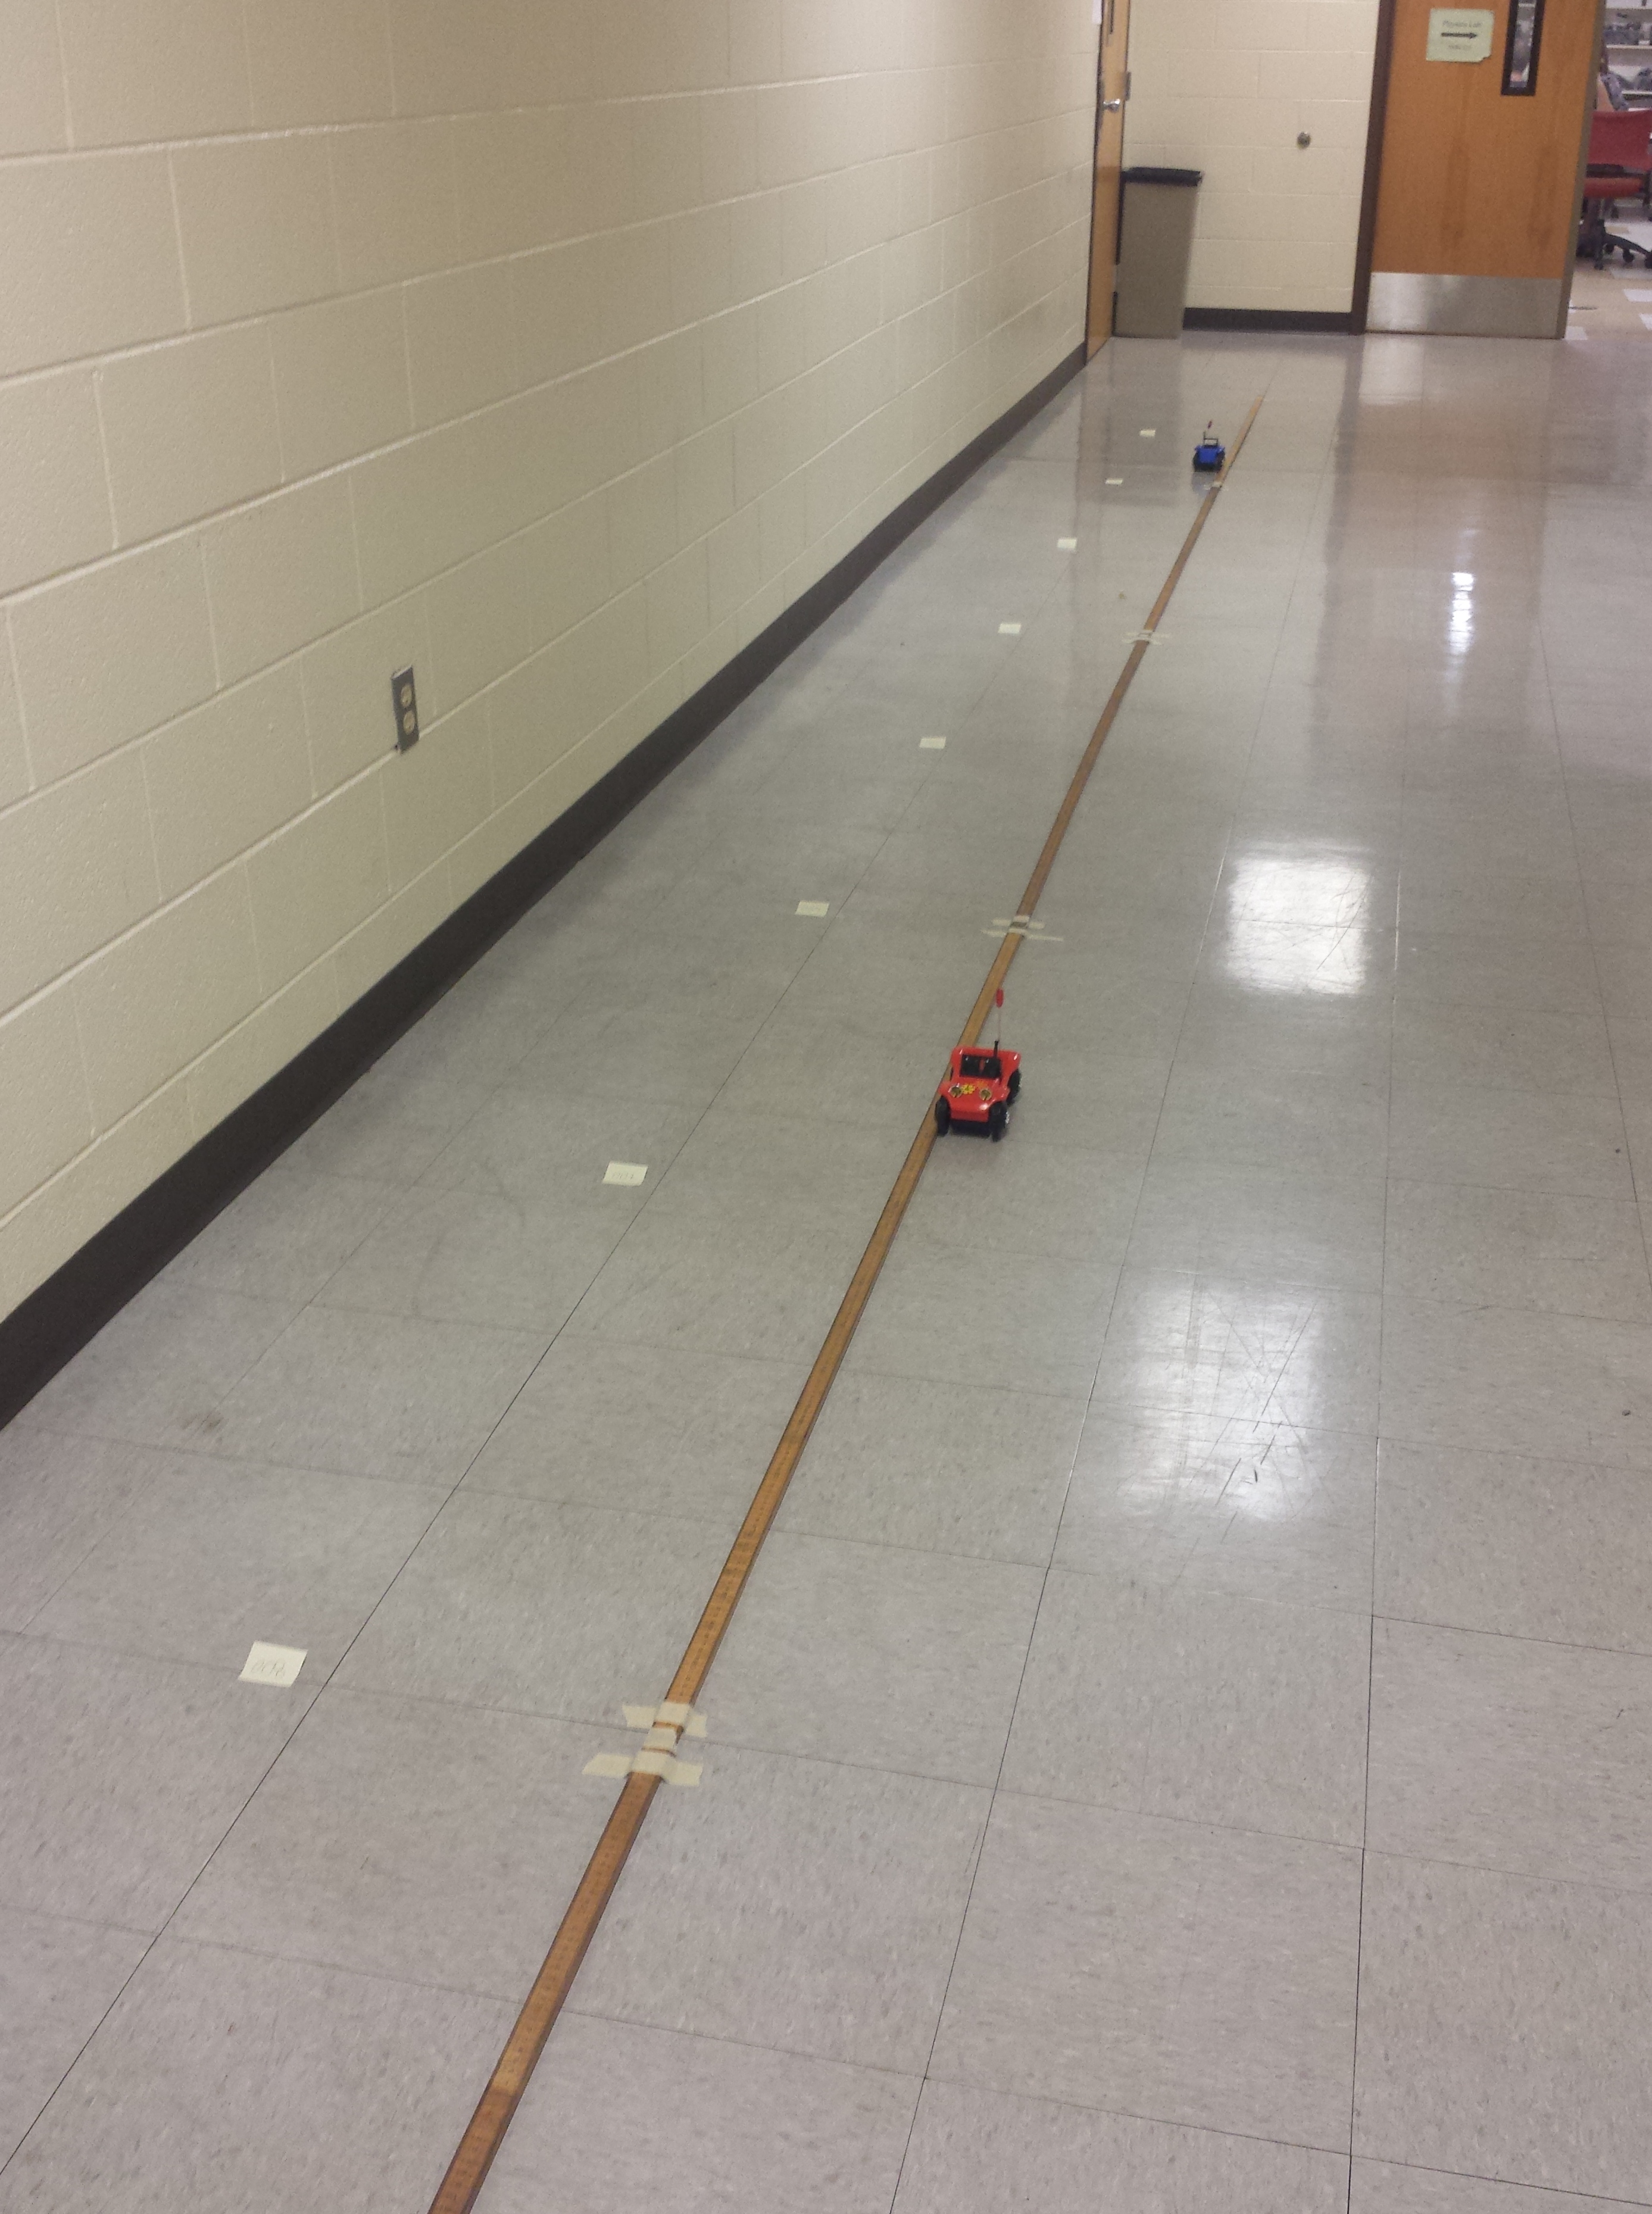
Here is a picture of the buggy highway we set up in the hallway:
Lab Uncertainties: Last Year vs This Year
For uncertainties, we used to have students estimate measured uncertainties, calculate percentage uncertainties, and then have students identify the largest (average) percentage uncertainty of all their measurement types before using that to propagate uncertainty to any calculated results (e.g., slope).
Now, we have students take multiple or repeated measurements to help inform judgments about which digits seem “trustworthy”. We defined trustworthy digits as those that don’t change much upon repeated measurements. This leaves some room for ambiguity which is fine– for example, we had clicker question to identify where the smallest trustworthy digit was with repeated measurements of 12.69 ft and 12.91ft. Either the ones place or the tenths place could be justified. For propagating uncertainty, we have students use the rules for significant figures, because that’s what is taught in Knight’s College Physics. Overall, I’m pretty happy with this approach. In the first lab, we actually had interesting conversations about uncertainty instead of mind-numbing conversations about how to apply the rules.
For example, one group had measured time repeatedly in their “Quick and Easy” speed calculation (before a more careful investigation), and found that their time measurements really only had 1 sig fig (something like 5.87s, 7.07s, 6.32s). They were unhappy with rounding 24 cm/s down to 20 cm/s. They felt like this was losing accuracy. When they later found the speed using graphical methods, they got 19 cm/s. They were really surprised that their 1 significant figure rounding was closer than their 2 significant figure rounding. One student said that hadn’t realized that such a thing was possible.

Thanks for sharing this, Brian. I was struck by this sentence: “They were really surprised that their 1 significant figure rounding was closer than their 2 significant figure rounding”
If we round 24 m/s down to 20 m/s because of a limit to our certainty in time measurements, I don’t think it’s fair to say that 20 is “closer” to 19. As I understand 20 with one sig fig, it represents a range of possible answers from 15-20 (just as 24 represents possible values from 23.5-24.5). In that sense, 20 with one sig fig might be closer to 19 than 24…but it might not.
Does that make sense? I’ve learned this through teaching it, and don’t bring a deep prior knowledge about sig figs. I’d love to hear more on this topic and learn from you.
I agree “closer” isn’t the right word… It would better to say that rounding to 20 ( implying a range of say 15-25) better “encompassed” 19, where as rounding to 24 (~22-26) did not. The students had really wanted to say that their timing was accurate to more than 1 sig fig which was implied by the variance in their data. I empathized with that feeling. In the students’ lab book, one wrote about what they learned, “I learned to trust what the data is telling me rather than what I feel is right.” … I hope later she also has a lab day where the opposite is true. Data and ideas need to be in dialogic, not one dominating the other.
Totally agree and understand. Thanks for clarifying!