Qualitative Cavendish Experiment: Prepping for PiM Lessons on Gravitation

Next week, we’ll be learning about circular dynamics and the universal law of gravitation. I plan on going through the Preconceptions in Mechanics lesson, very similar to the lesson as described by Frank. In the lesson, students are asked about to think about various possible causes of gravity (earth’s spin, earth’s magnetic field, earth’s mass, etc). They observe demos and discuss in a sequence. One might typically end the lesson by watching a video or reading about Cavendish’s famous experiment.

So anyway, over fall break, I got the itch to actually set up the cavendish experiment for myself–qualitatively that is. I originally set it up on the ceiling cross bars in the physics room, but these are just some flimsy aluminum cross bars that hold up paneling. I ended up moving my setup to a door frame to keep vibrations from the building from interfering. I’ve run the observation experiment dozens of times now, and was even able to show it live to a friendly colleague from Speech and Pathology. I’m pretty convinced that what I’m seeing is the gravitational effect, because I can get it with 100% reliability in both directions. There are few tricks to getting it working well, mostly just giving it time to reach equilibrium, and being careful when moving the bricks. But it’s really not terribly difficult. This could easily be a good project for students.

Here is what my setup includes and looks like:

  • 1 meter stick
  • 2-200 gmasses
  • 2 lead bricks
  • fishing line

IMG_1281IMG_1280

Here is a time-lapse video of a setup with a big deflection. The actual video is about 10 minutes long. I used i-phone time-lapse to make this. [Edit: This video, likely has acceleration from torsion in the string. Andy helped point out that this much deflection would likely take more time than reasonable]

I also have a time lapse video with a smaller deflection zoomed in on just one side: [Edit: This video seems more reasonable]

I plan on at least setting up the experiment for students and showing the video. I may venture into actually showing the demo in class, but I’m worried it will be hard to do. I may want to make a better video that’s not so nauseating. I’ll also let you know if I find time to approach the experiment quantitatively to estimate G.

Let me know if you have any questions about the setup.

Edit:  In general, what I’ve learned is it can take a long time for the system to settle into equilibrium before you bring the lead brick nearby. The next day when I went back to do experiments, people in the upstairs gym were playing basketball, and the system never reached equilibrium. The pendulum would twist 5 degrees or so back and forth over — over long periods of time. Moving to a building that is really isolated from vibrations is important.

Pivoting Toward Net Force Focused: A Day of Success

Thursday, in algebra-based physics, we pivoted away from the standard algorithms for solving forces problems and toward “Net Force focused” approaches.

We started the day with the following ranking tasks:Slide1

The point here was to get students oriented to thinking about Net Force in more concrete terms using “mental math”, and thinking about Newton’s 2nd Law in terms of how Net Force act on an object to cause acceleration (rather than a prompt to write down an algebra statements).

Later in the day, students were solving problems with interacting objets. An elevator with two stacked crates (5 kg on top, 10 kg on bottom) was accelerating upward at 3 m/s/s. Students had to find the force between the crates.

It made a whole lot more sense to students to say that the 5kg block needed a Net Force of 15N. Since the weight force pulls down at 50N, the upward force must be 65N to make the Net Force 15N. Similarly for the heavier block, although the reasoning is more subtle because you have to apply Newton’s 3rd law and contend with three forces instead of two. But students were able to get to the answer that if the heavier block is going to have a Net Force of 30N, their must be an upward for of 195N to counter the downward weight force of 100N and the downward force from the top crate of 65N.

Some groups still took the more formal algebra-based approach, but as a class we compared and contrasted the two approaches, which seem to help students make sense of it even more.

During discussion, we decided it was very helpful it is to actually draw the Fnet vector next to your freebody diagram. We also decided that after drawing free body diagrams with symbols, that we should label the value of forces (and/or net force) as we figure them out. So label the weight force w, but then write 50N next to it once you calculate that, etc. Same with Net Force Vector–once you have determined it’s 15N, you should write that next to your diagram.

In this approach, we are using the free body diagrams to support our thinking about the force arithmetic, as opposed to in the standard algorithm where you use the free body diagram to support you in writing down algebra statements.

The good things are this:

1.  We are doing more “sense-making” about the physics rather than following algorithms.

2. We are using math skills that are (more) empowering for (more) students.

3. Students now see the diagram as useful (and have even suggested ways they could be more useful).

We are certainly not all still there. Students need to be supported at times in some of the following:

A.  A few groups when they calculate the Net Force… they are prone to want this to be one of the forces acting on the block. They might decide it’s a force, or they might ask, “Which force is 15N?” This is a confusion I’m happy to spend time on, since it’s about physics, not about Math.

B. There are still quite a few students that struggle with mental math–it might take them several trials of guess and check to arrive at conclusion like… if there is 50N down and we need 15 N Net Force up to decide that the upward force must be 65N. This is math I also think is worth spending time on for these students, because if students’ number sense is like this, there is no point in doing crazy algebra.

C. Of course groups needed support in drawing the FBDs; we actually paused mid-problem-solving to share and discuss. Multiple normal forces with stacked objects is very challenging for students. A few groups even wanted to say that the elevator pushed on the top block. This is where system schema would help, but students are supposed to “draw” the boundary around the object of interest, and identify contact forces by which objects are in contact. Most groups who made these mistakes didn’t take the time to draw the situation out, identify the boundaries, and explicitly think about it.

Alternatives to the Standard Algebra Algorithm for Forces

In my previous post, I was writing about my dissatisfaction with teaching the standard algorithm for solving Newton’s 2nd Law problems. The standard algorithm is to sum the forces algebraically and set them equal to mass times acceleration.

A viable alternative to this approach is Force Vector Addition Diagrams. This alternative has lots of upsides, but one in particular that I like is the emphasis on Net Force. My argument here is going to be that the standard algorithm mostly avoids ever explicitly thinking about Net Force.

For example, consider a problem where a Tension force of 30N is accelerating a 7kg block at 3 m/s/s. The problem asks you what is the friction force acting on the block?

The standard algorithm would look like

 ∑ F = ma

T- f = ma

f = T -ma

f = 30 N – (7kg)(3m/s/s)

f = 9 N

A conceptual / numerical approach that focuses on net force might look like this

  1. OK, so how much force would a 7 kg object need to experience in order to accelerate at 3 m/s/s?

    a = Fnet / m
    (3 m/s/s) =  Fnet / (7 kg)
    21 N of force would be needed.

  2. OK, well how do we get 21N of force from these two forces?  Well, we have 30 N pushing forward.  That must mean we have 9N of force opposing.

These approaches are logically equivalent, but conceptually miles apart in terms of the thinking that a person does. The first one basically just uses Newton’s 2nd law as instructions for how to write your algebraic sum of forces statement. And then it’s mathematics. It basically never explicitly says, “This object is experiencing a net force of 21 N”.

The 2nd approach treats thinking about Newton’s 2nd law separately from (but connected to) thinking about the sum of forces. It first asks the question, “How much force would get the job done?” and then, “How did the individual forces conspire to make that happen?”

So in my previous post, I suggested that the standard algorithm may not be right for students who are weak in algorithm. I want to make a stronger claim here. Whether one takes a more graphical approach (like in the link above) or any another approach (like the approach laid out here), I’ll venture to propose the following: Any algorithm that skirts explicit thinking about Net Force is likely to be a mistake (especially for students just learning Newton’s laws  and/or those with weaker math skills).

Note 1: Part of this has me thinking about the idea of “standard algorithms” in mathematics, and how the issue here is very similar. While this paper is about prompting force diagrams, it’s basically related in the sense that forcing students’ to use standard algorithms has unintended negative consequences. In the paper, there are examples of more intuitive approaches, where students successfully solve problems by calculating in bits and pieces rather than the standard algorithm.

Note 2: A second questions relates to if/ how / when to move students toward something more like the standard algorithm. What contexts help motivate it? What scaffolding helps bridge it? What populations of students should this even be a goal for?

When Formal Approaches Disenfranchise Students’ Natural Problem Solving Skills

One of the reasons why I dislike teaching “algebra-based” physics in a fast pace manner is that for many students algebra is barely in their grasp. This becomes most apparent when we first starting learning about how to solve problems related to Newton’s 2nd Law.

For example, today students were solving a problem, where a 4 kg is being pushed with a 30N. The coefficients of static and kinetic friction are 0.5 and 0.3 respectively. The question is, does the block move, and if so, with what acceleration?

Students all correctly identify that the maximum static friction force is 20N (based on normal force being equal to weight), and so 30N is enough to be in the kinetic regime. They can then calculate the kinetic friction force as 12N. Many of these students can readily say that 18N is the net force acting on the object. Then most can at this point say that a = Fnet / m  =  4.5 m/s/s.

Students’ productive and natural problem-solving approach does not look like what we teach them do:

F_net = ma

F – f_k = ma

F – u F_n = ma

F – u mg = ma

a = 1/m (F-umg)

Students of course just simply do this in “chunks”, calculating pieces along the way, comparing values, doing arithmetic calculations. The formal approaches codify these chunks into the algebra and string them together. Logically that’s true, btu students do not experience it that way.

I think that teaching the formal approaches has the promise of being generally powerful (that’s the allure to teach it this way), but in reality it mostly disenfranchises students from their natural problem-solving skills, their ability to apply insight into problems, and to make sense of what they are doing.

What compounds the negative effects of teaching abstract algebra approaches is that it has quite varied effects.

  • I do have some strong algebra students and sense-makers who can apply the formal approaches and make sense of them as they do.
  • I also have some good “algorithm” followers who can apply formal approaches, but are not making sense of them. They follow the script.
  • I also have strong sense-makers who will approach problem from their own intuitive approach, basically ignoring the approaches you are trying to teach them.
  • I also have students who cannot follow the algorithms, and feeling disenfranchised from anything resembling sense-making, they cobble together strange algebra.

Having one or two of these different types seems manageable to me, but having all four I find hard to navigate.

Desmos Ramp Simulator and Activity Builder

Here is a desmos file I made earlier today, where you can explore motion on frictionless ramps… nothing special.

I also turned it into a activity builder, where students

(1) Share their answers about how to find the acceleration from the simulation

(2) Make a prediction about what an acceleration vs angle graph will look like

(3) Teacher projects the overlay of all students’ points as they flesh out more and more of the graph

Desmos is working on a qualitative sketch feature, so that students can make qualitative sketches that also can overlaid.

Here is a link to the activity file:

https://teacher.desmos.com/activitybuilder/custom/5606bfe306b1de7426841450

To try the activity from the student perspective, you can go to student.desmos.com and enter the code: “5HQC”

Day 1 of Forces: Cool Arguments for What Forces Do

The cool part of this post is students’ arguments in part 3, but I wanted to share how we got there, and what we did with it. Overall a great day in Physics I.

We started the day by introducing a force as the book does:

A force is as a push or pull

A force always acts on an object (that experiences the force)

A force always occur because of agent (who exerts the force).

I add to that definition that a force is something that happens (like a party), and that it could be happening for a while but later not be happening.

1. Normal Force Bridging Analogy:

We then did the Normal Force Bridging analogy from Preconceptions in Mechanics. We do demonstrations, vote, and discuss the following situations.

  • Is table exerting a force on the table?
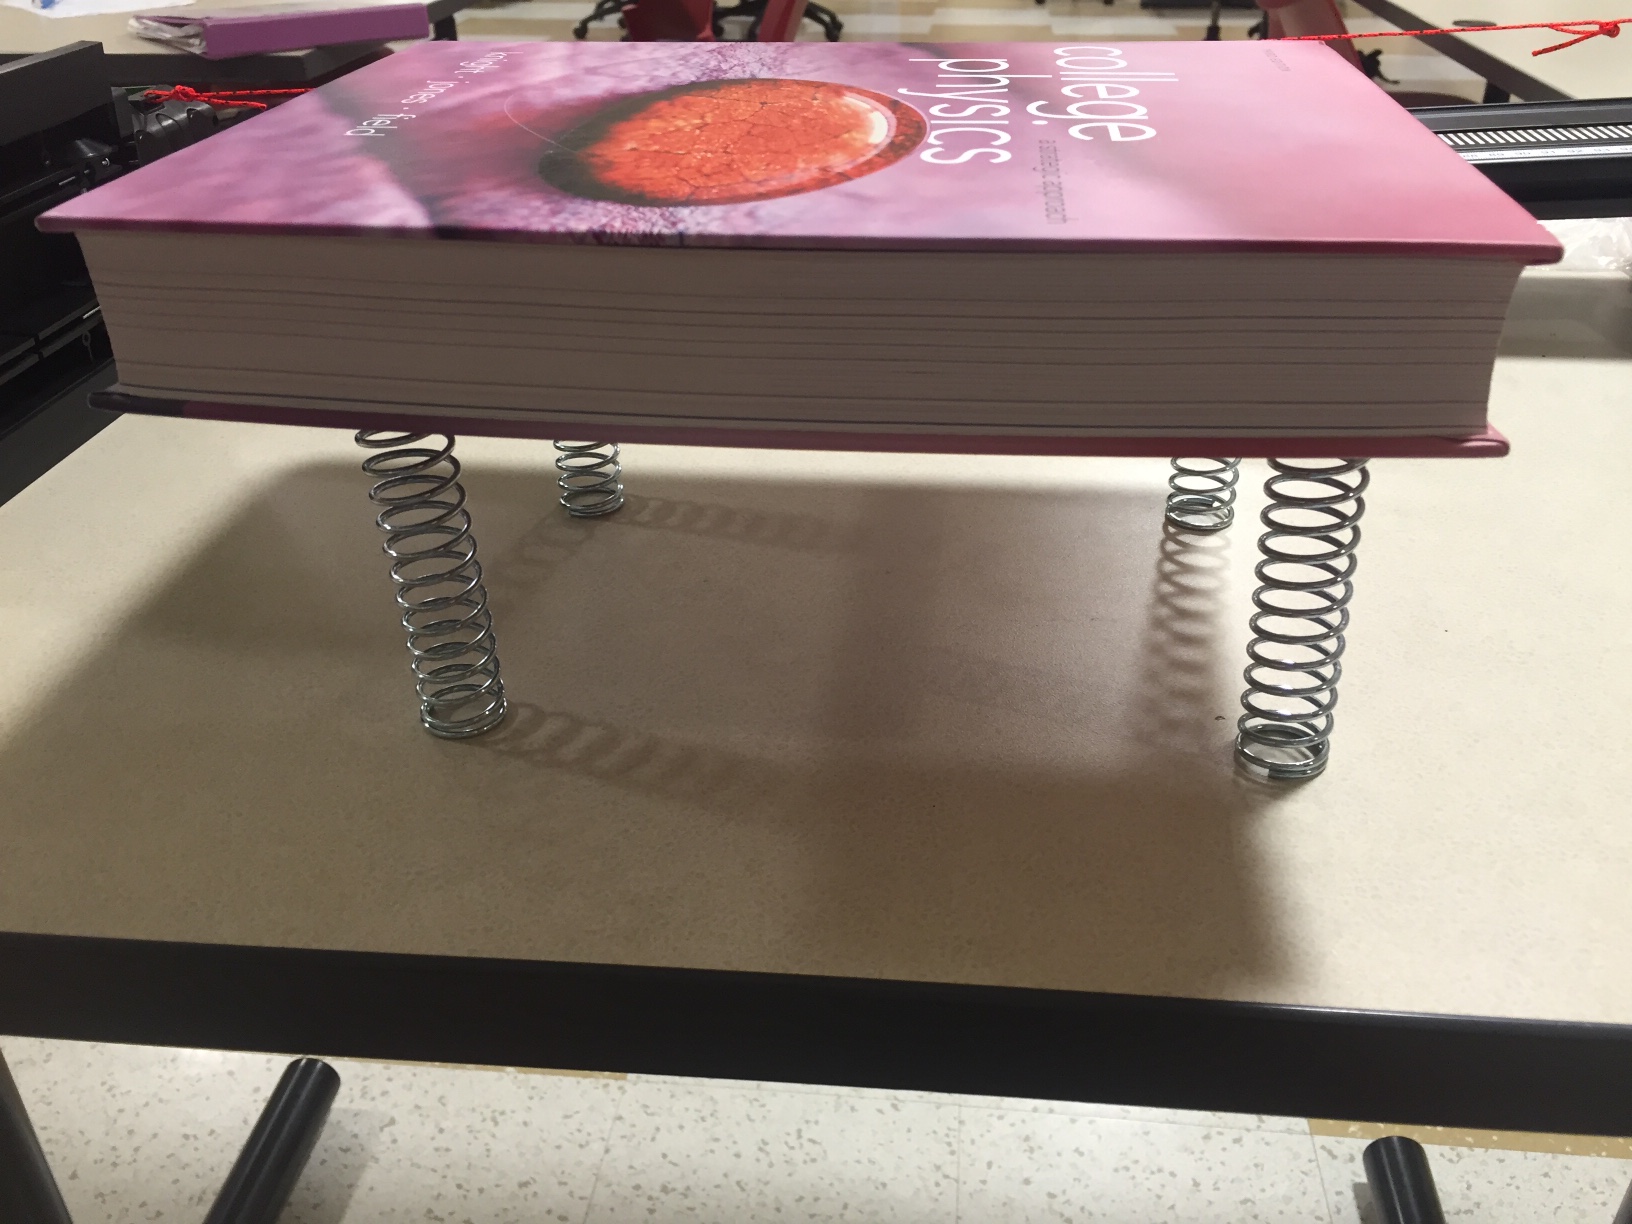
  • Is the spring exerting a force on my hand?
  • Is the spring exerting a force on the book?
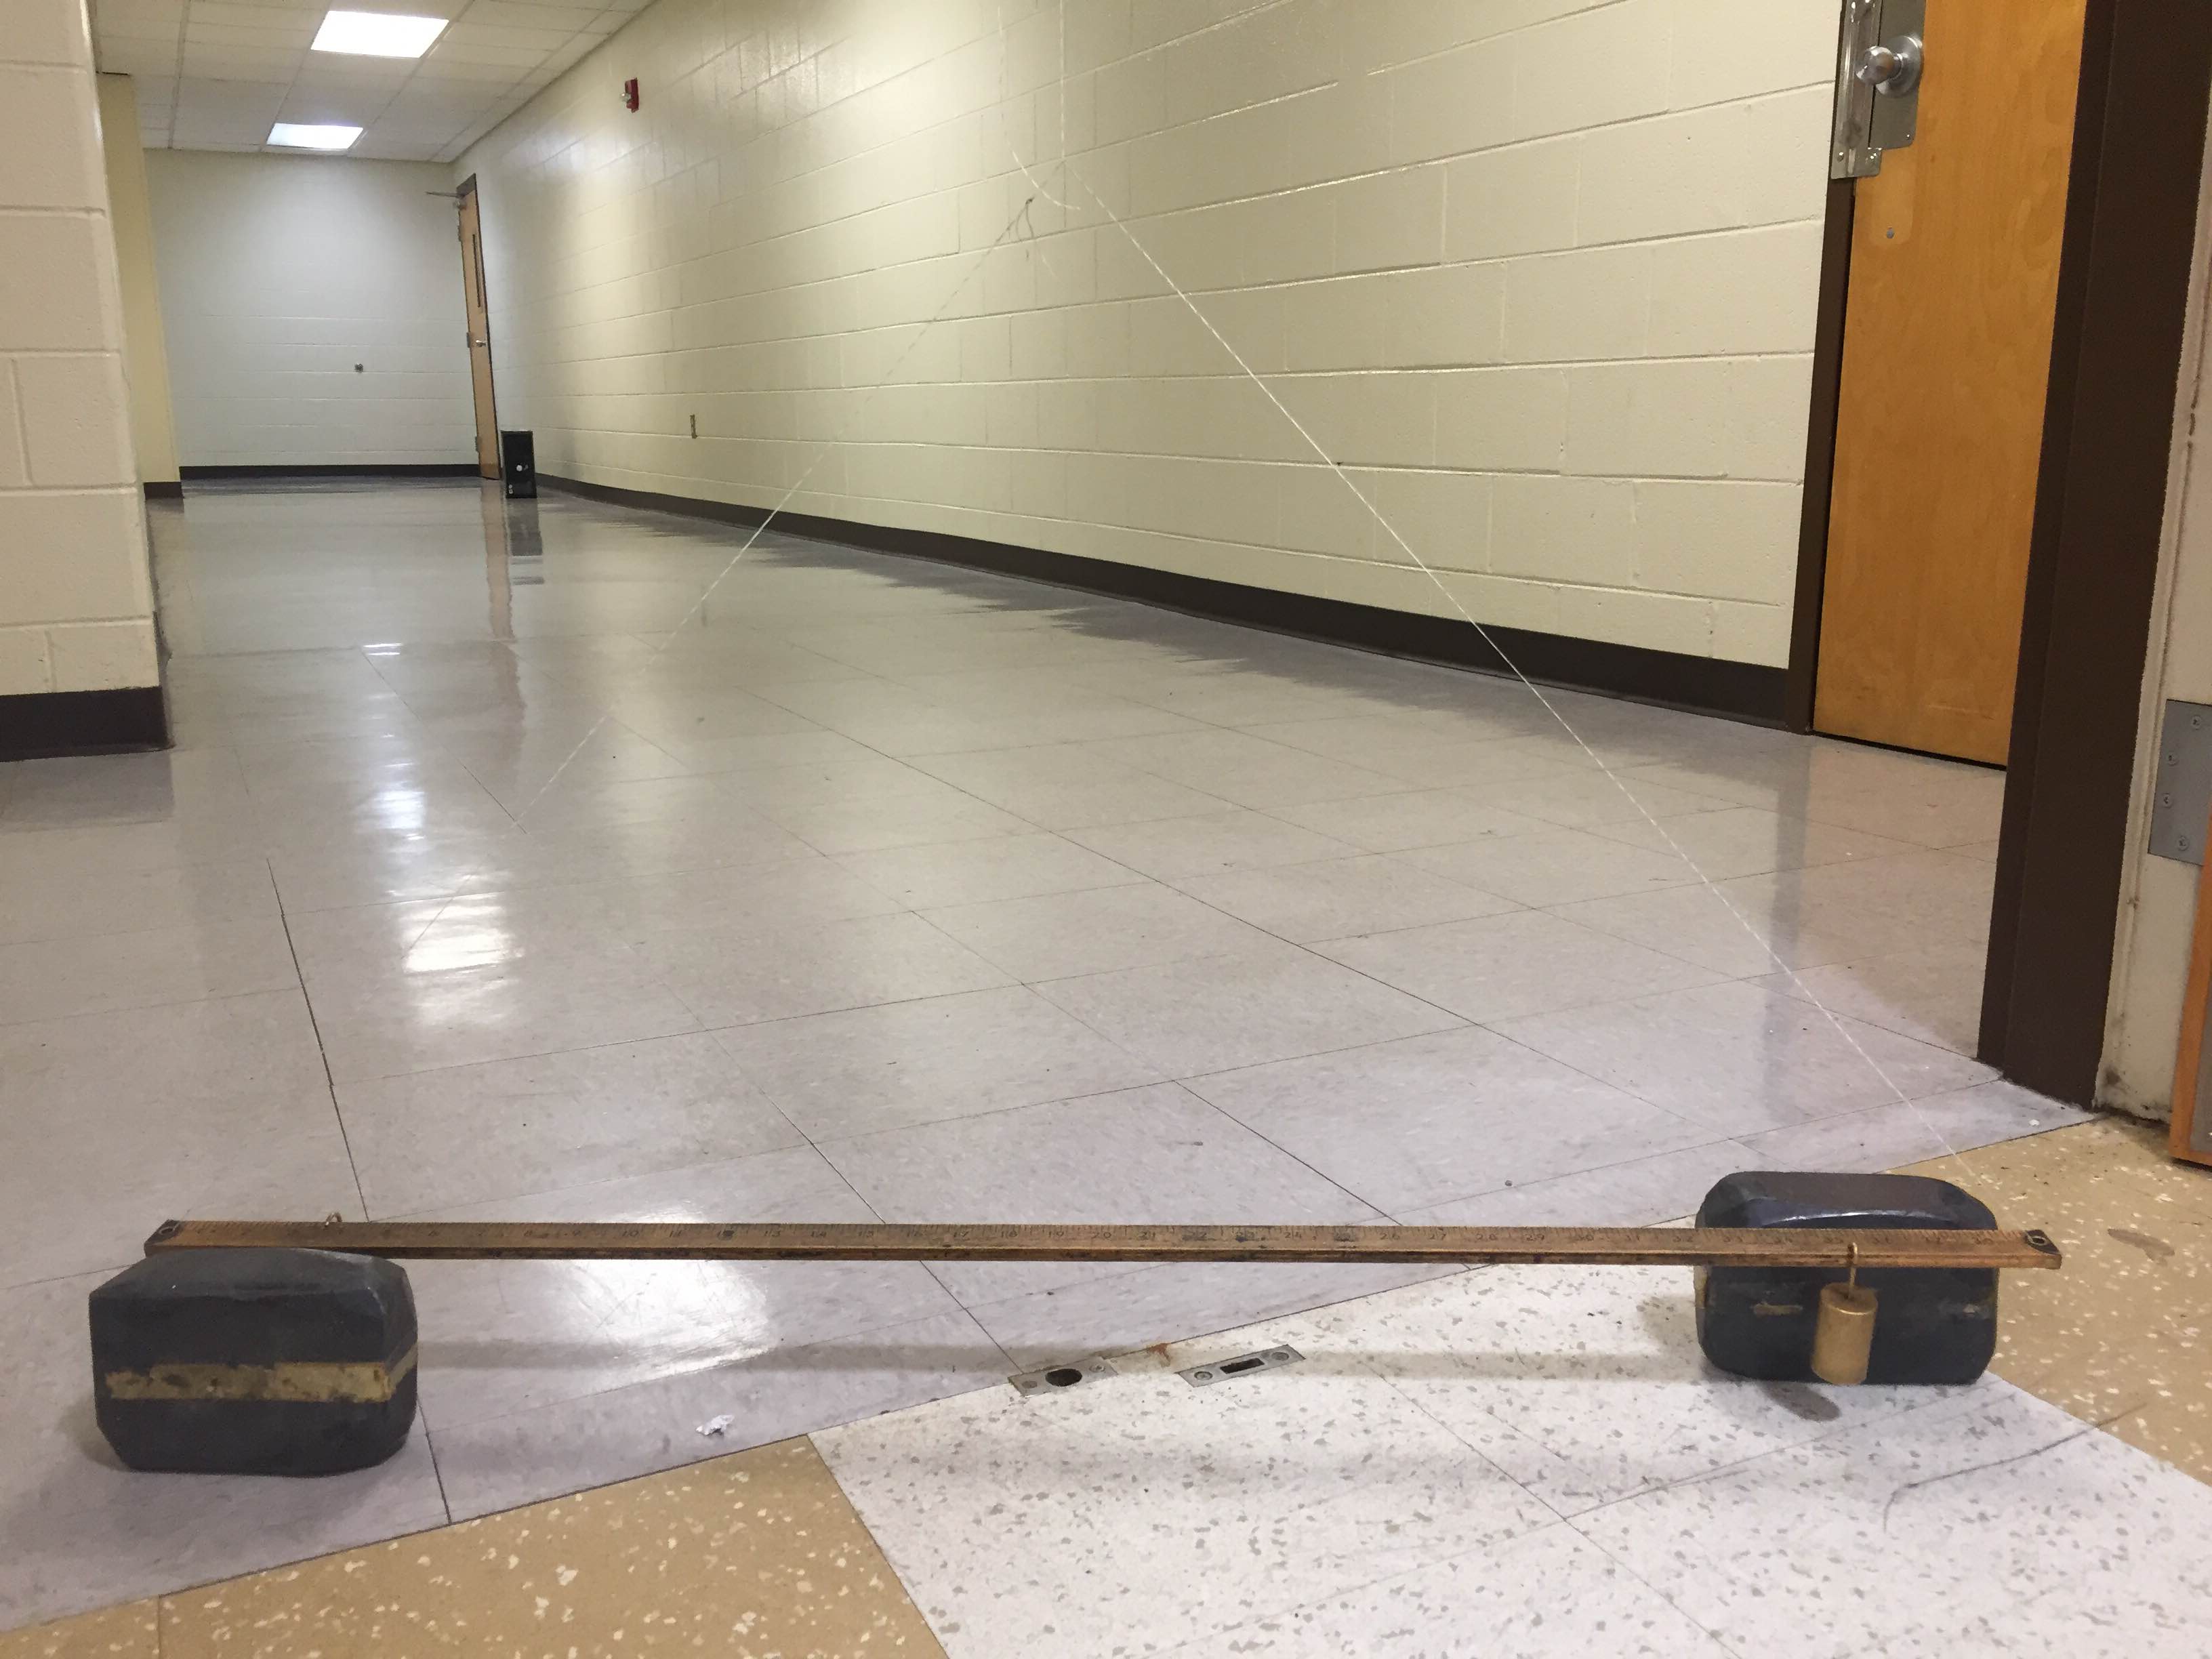
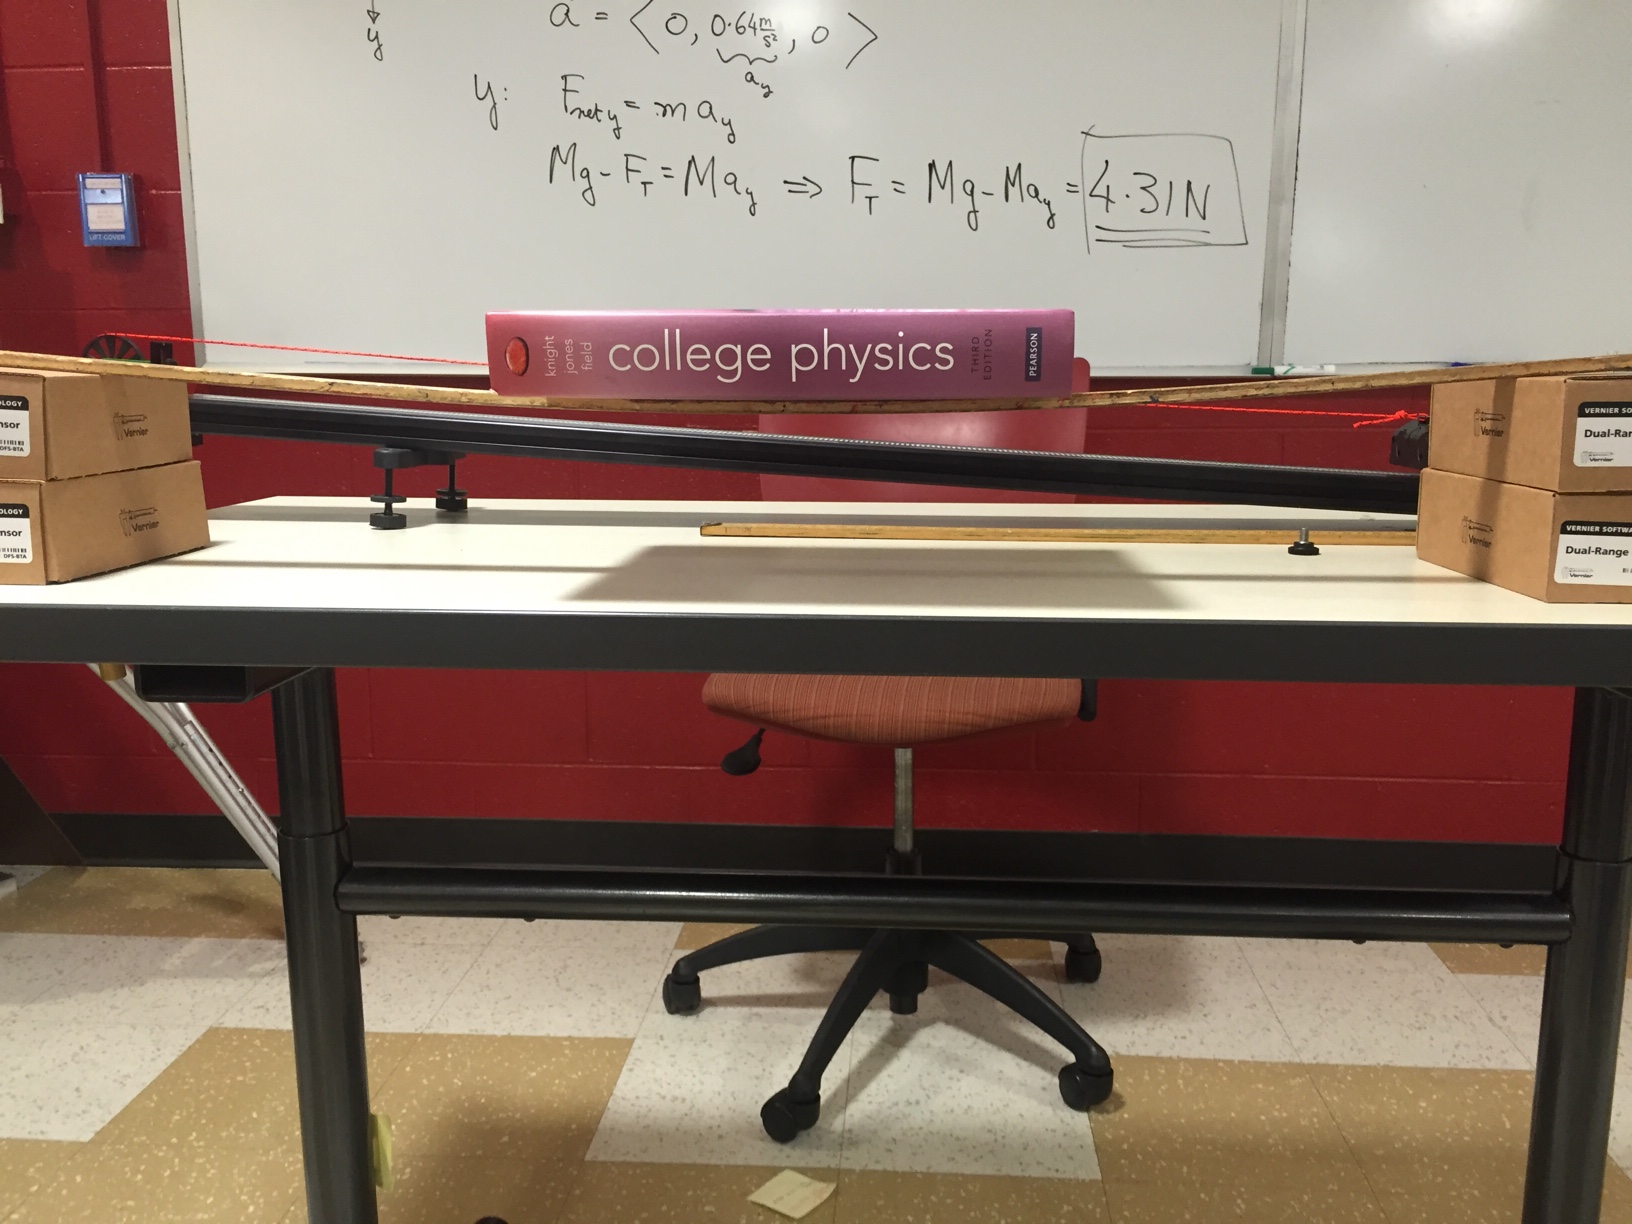
  • Is the meter stick exerting a force on the book? (What about two, three, or four metersticks?)
  • Is the foam exerting a force on the book?
  • Is the table exerting a force on the table?

The point is to keep the conversation focused on observable evidence of pushing (deformation, compression,). Then you do an experiment with a laser on a mirror that’s been placed on the table. And then you stand or sit on the table. That went pretty well.

Normal Force-Book on Springs

Normal force-book on meter stick

2. Identifying Forces- Example and then Whiteboarding:

A Brief Lecture to Introduce a few other Forces, then a Demo to Model how to identify forces:

Demo Setup for Identifying Forces

Knight’s books starts, not by drawing free body diagrams, but by drawing a picture, identifying the object of interest, drawing a boundary around the object, identifying an other objects that cross the boundary (exerting contact forces), and then identifying any long-range forces.

I modeled how to draw a good picture and identify the forces for the setup above, and then students white-boarded 4 situations.

3. Pre-Lab Clicker Question: What does a force do?

After debriefing on the white-boarding, I transitioned to identifying when forces are happening to what do forces do. I posed the following clicker question:

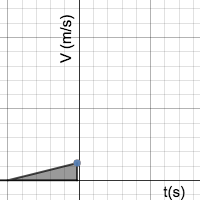
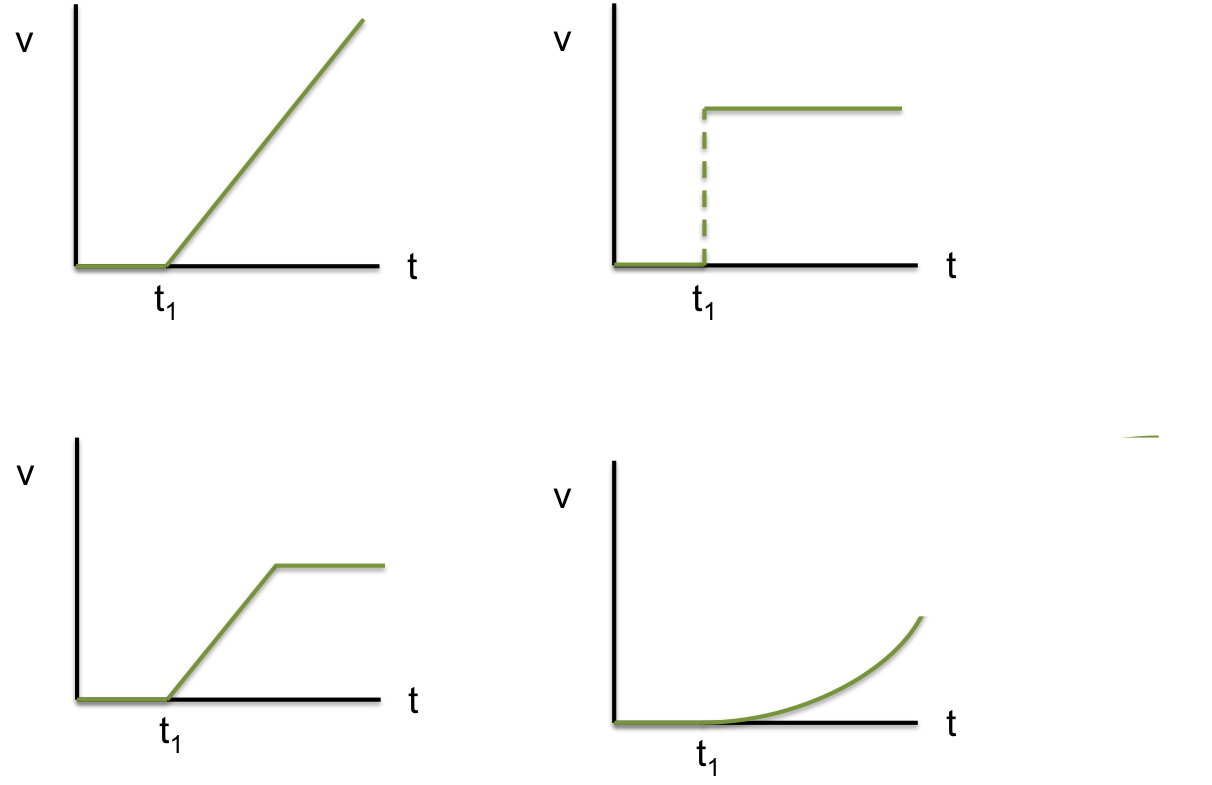
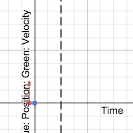
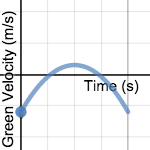
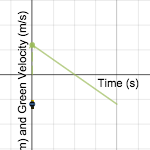
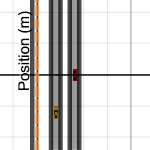
“A cart on a track starts at rest. At time, t1, you push on a cart with your finger. As it moves you keep your finger pressure the same for the remaining time.”

Graph Choices

Student arguments were really cool:

A. It has to either be the top-right or the bottom-left. The problems says the finger is pushing the same way, so that means it’s going to move with a constant speed. It might be that you’ll be able to see it speeding up, or it might happen so quickly it looks like a jump.

B. It has to be either of the top two. It says the finger pushes the same way. I don’t see how it could be the bottom-left, because the finger is doing the same thing the whole time. How could the graph change what it’s doing if it’s finger doing the same.

C. I don’t think it could be the top right, because the velocity can’t just jump up to a speed right away. When you are driving in your car, you can’t just go from 0 mph to 50mph immediately, the speedometer has to pass through all the speeds in between.

D. The question says that finger is pressing with the same pressure, but I don’t necessarily think that means you push with the same speed. It doesn’t say you push with the same speed. I’m still trying to figure out what same pressure on your finger would do. Like, If you push something uphill, the same pressure might not be enough to push it up, or it might be just enough for it to keep a speed. But if you push something on a  flat track, same pressure might be enough to keep it speeding up.

E. I think it depends whether there is friction. Like if you are pushing something across a carpet, there’s a lurch. Like it’s not moving and then all of sudden it goes. With the cart’s in this class, there’s not much friction, so there’s not going to be a lurch. The only graphs that are smooth looking, are top-left and bottom-right. After t1, they do a smooth thing.

Students had a good conversation, and I facilitated well—mostly using re-voicing to clarify and compare/contrast ideas. The usual suspects in class were contributing, of course, but a lot more people jumped in, which was good.

4. Lab Exploration:

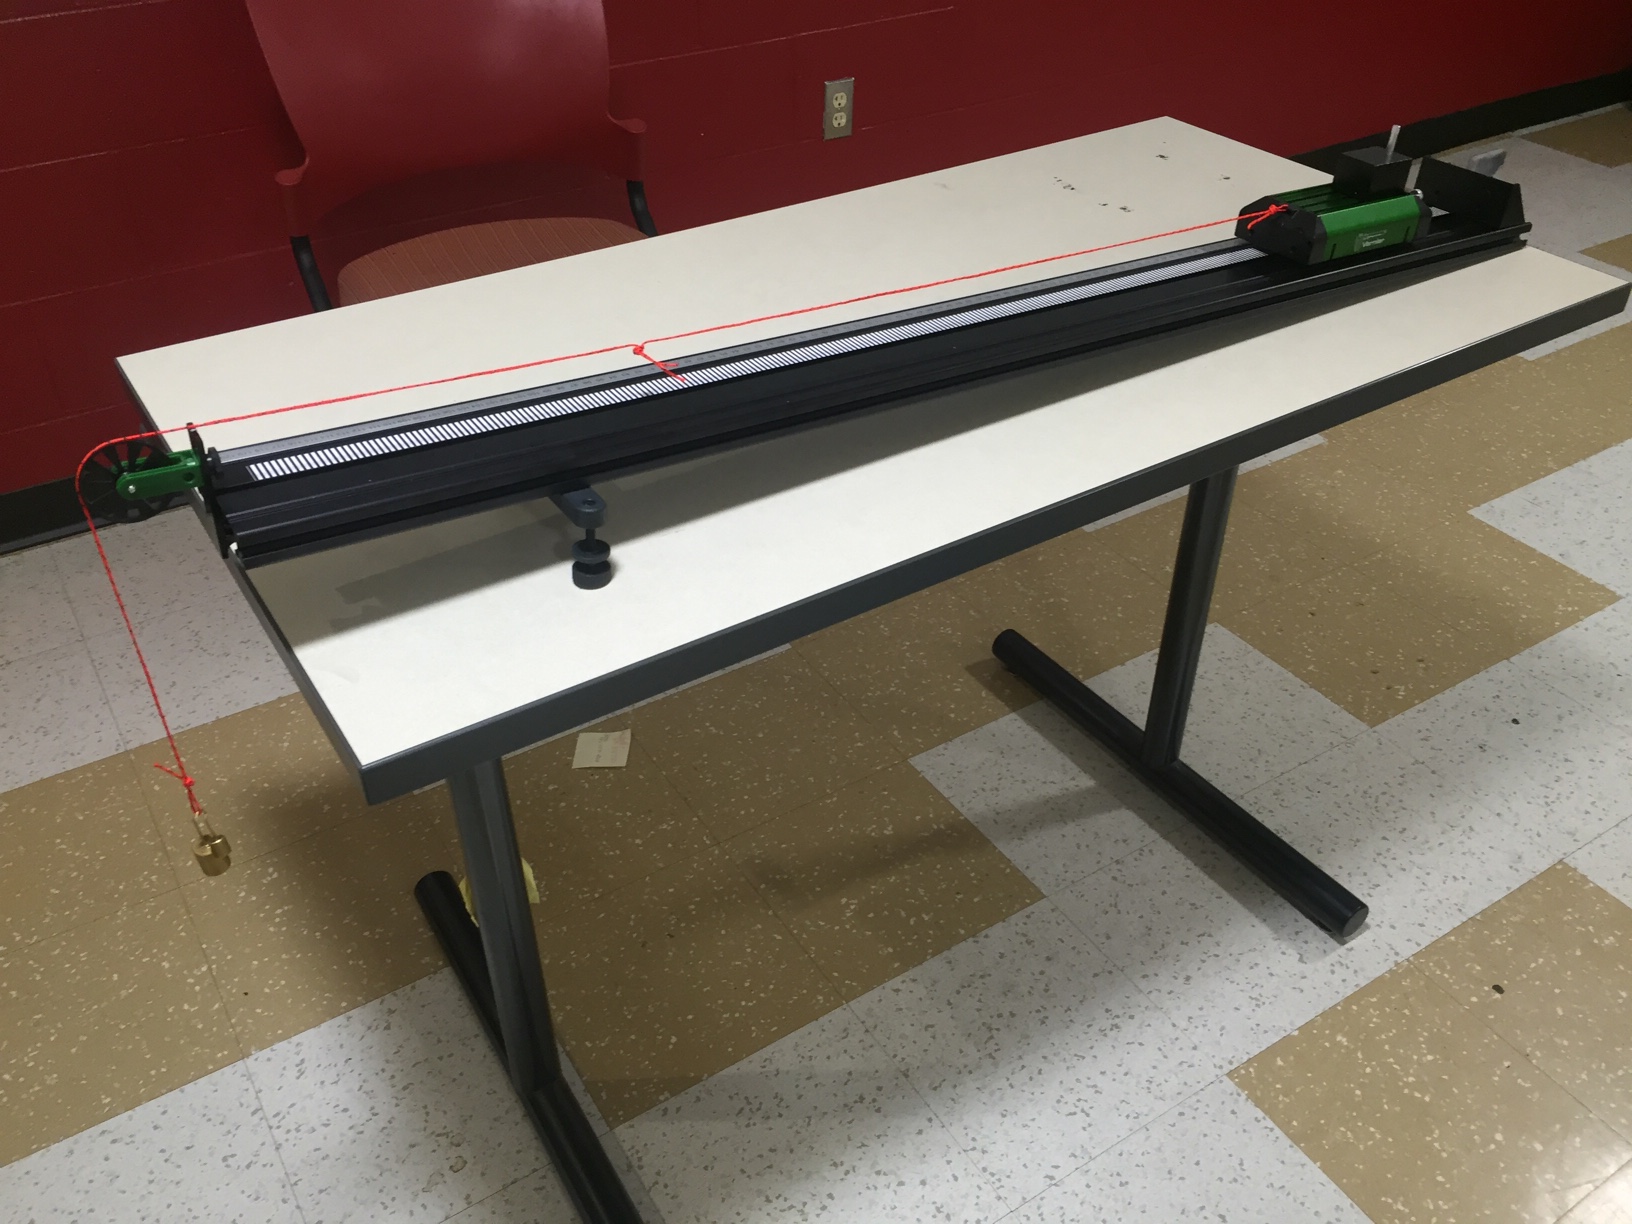
Students were then asked to do some experiments to help us decide what forces do. They did their experiments with Fan Carts and Motion Detectors that mirrored our discussion.

Experiment 1:  Make a Velocity vs Time graph (Record on whiteboard]

Experiment 2: Set fan to higher settings  (Record on same graph, see what if anything changes)

Experiment 3:  Do an experiment of your choosing

  • Some groups changed the mass of the cart
  • Some did slowing down instead of speed up
  • Other groups added friction or obstacles along the track
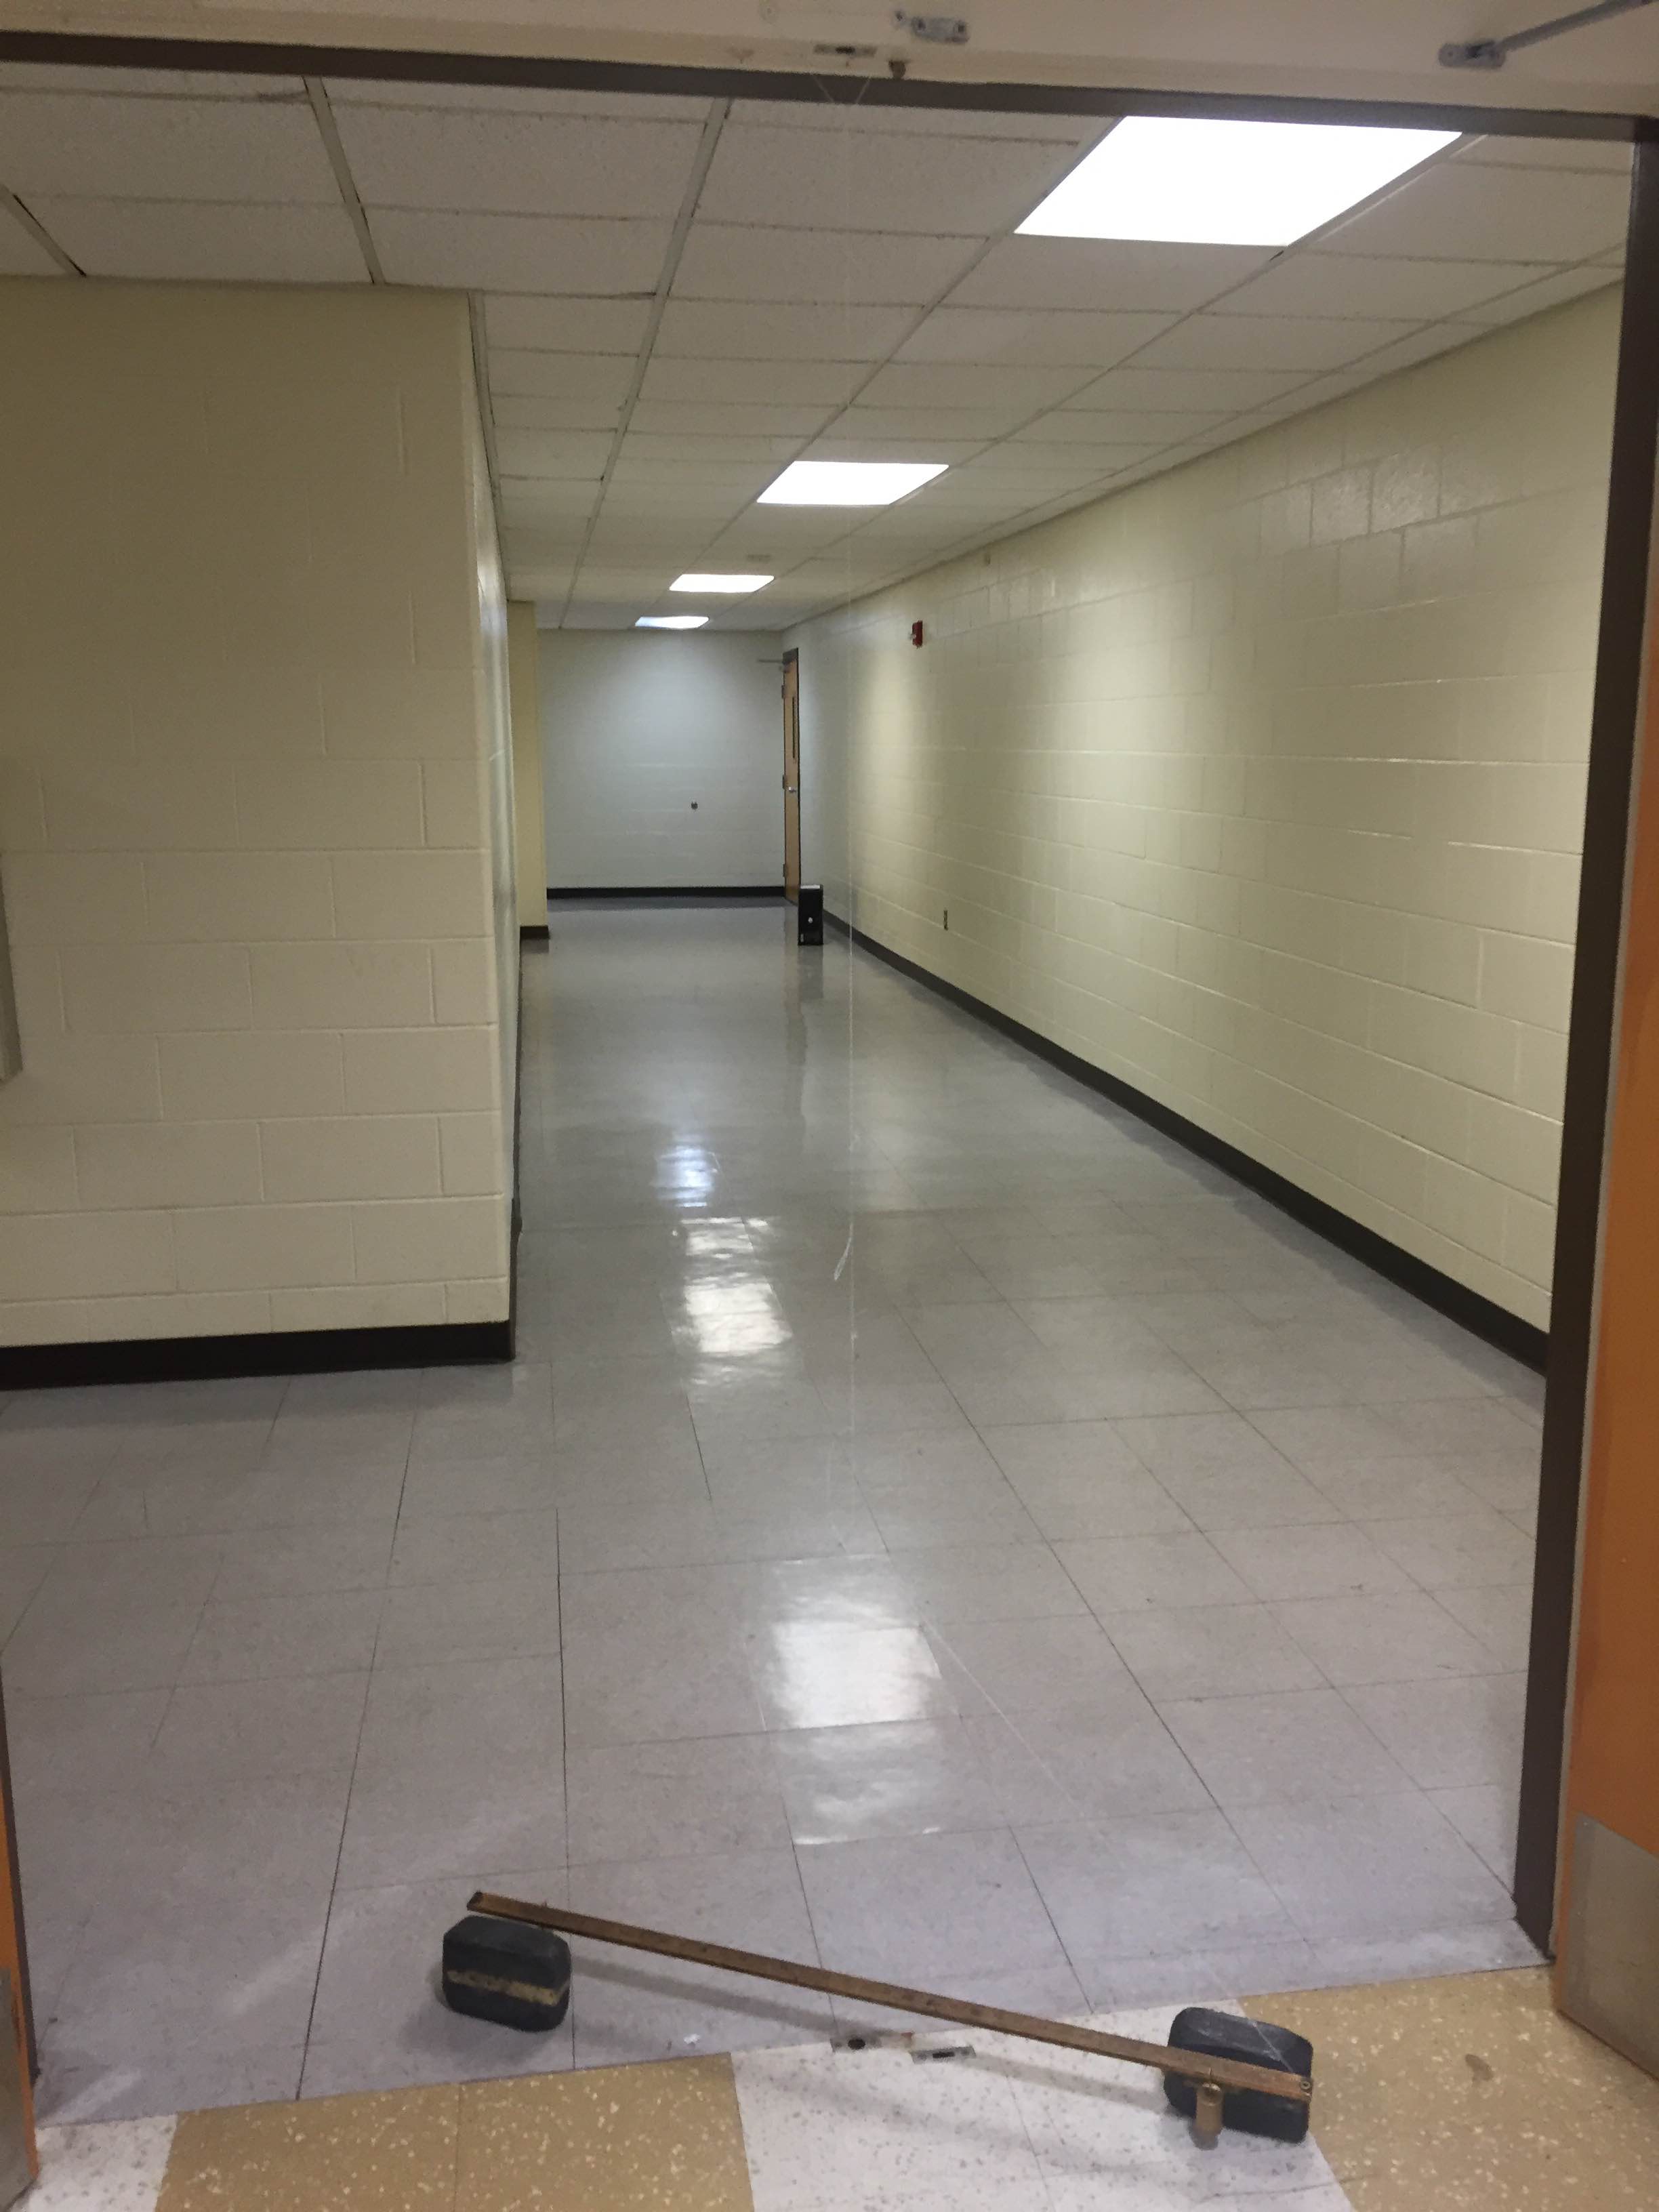
  • Other groups wanted to try longer tracks (to see if it would level out eventually)- I gave these groups hover pucks to play with out in the hallway.

While circulating, we had lots of really good discussion and questions about what they were seeing, what it did or didn’t show evidence for, what would be different if there was friction, etc.

The pre-lab clicker question did a really good job of setting up the lab exploration. Students knew what they were trying to do and had a sense of purpose– help us decide what a forces does. Students found a nice balance between pursuing the lab goals and playing around to see what happens. For example, one group kept trying to change the mass of the cart so that a buggy and the cart would get across the track at the same time.  Another group tried to add just enough mass to the 2nd fan cart setting so that it would accelerate that the same as the 1st fan cart setting with now mass.  They were heard cheering loudly when they made that happen.

Second Challenge Lab: Projectile hits the Buggy

In our second challenge lab of the semester, students had to predict where a ball would land after rolling off a table, but also predict where to release a battery-powered buggy so that the ball hits the buggy as it drives by.

The setup was that ball first rolled down a brief starter ramp and then went briefly on horizontal track before going off the table. They were not allowed to let the ball roll off the table before the experiment, but they could collect data about the motion of the ball along the horizontal track and motion of the buggy along the floor.

IMG_1176

Collecting and Analyzing Data:

5/8 of the groups decided to measure the speed of the ball using a motion detector, where the struggle was to interpret exactly what what the graph was showing and how to get the velocity at the end of the track. S

1/8 of the group used a single photogate setup, where challenge was to align the sensor with the center of the ball so you know the length of travel while in the gate.

2/8 of the groups used a two photogate setup, where the two photogates were set close to each other and students used distance between the gates.

For buggy various groups used motion detector or stopwatches and meter sticks.

IMG_1174

IMG_1175

Students had about 2 hours to complete the lab, which included time to plan, collect and analyze data, and then make their predictions before observing. Most groups actually hit their buggy, but a few groups only came close. The challenges were:

  • Not working diligently enough to get a reliable starting condition to get consistent speed of the edge of the table.
  • Not isolating carefully enough the instantaneous speed of the ball (but perhaps an average speed). The ball doesn’t slow much across the track, but enough. One group used a two photo gate setup, but actually used each photogate as a single setup, say that the speed dropped from about 62 cm/s to 58 cm/s. Another groups calculated slope of position vs. time across the first half/ second half and found 58 cm/s vs. 55 cm/s.
  • Not working diligent enough to get a good measurement for the time spent on ramp and track. Some groups were so diligent in other areas, but then rushed this part. Often it was the last thing students did, because it dawned on them later that this extra time mattered for knowing where to release the buggy from.
  • IMG_1203

All and all the day was pretty successful. Students were engaged, with many taking different approaches to collecting and analyzing data, identifying and working through different issues that arose for them. Students are getting the hang of being presented challenges, transforming the situation into a problem, and deciding they want to collect data and with what equipment.

On Thursday, we switch to new groups and start our new unit on Forces.

Projectile Motion and Newton’s 2nd Law Desmos Simulation

More playing around with desmos. These are not “student activity” ready or designed by any means, but here they are:

Projectile Motion Visualization [click on image]:

Visualizes the position of a projectile motion as a vector equation (rather than components)

Newton’s 2nd Law Simulation:

When you open this link, all the features will be turned on (show all vectors, show all graphs, and even friction is turned on), which is overwhelming. I would imagine typically you would want to start with most of the settings off.

You can adjust how typical Newton’s 2nd law stuff:  Force and mass, but also how long you exert the force, and the coefficeint of friction.

You can choose to show force vectors, velocity vectors, motion diagram, positon vs. time graph, and velocity vs. time graph.

The simulation is set to run for forward for 10 seconds. Desmos, will then immediately start to run the simulation backwards.

Below, you can open the simulation with more of settings not turned on:

fe

Buggy Simulation Blended with Graph Representations

Just more messing around some. In this one, you can make changes to the buggy’s motion, and see how position vs. time and velocity vs. time graphs change. [Edit: see improved simulation below]

Edit: Here’s an updated one with following features added:

– Better Looking Velocity Vectors
– Acceleration Vectors
– Displacement Vectors
– Motion Diagrams
– Better visual scaffolding of link between velocity vector and velocity vs. time graph
– Tangent Line for Position vs Time
– Area Under Curve for Velocity vs. Time

Buggy Motion Matching in Desmos

More playing with Desmos…In this one, you watch a yellow buggy move, and then change values for red buggy to match it. This would work well in the activity builder–where students take turns creating scenarios and others students trying to match.


[Clicker Image to Open Desmos File]

Blog at WordPress.com.

Up ↑