
With broken ankle, I’ve been spending more time learning how to use desmos. I’m not really using these with any students yet, just messing around and seeing what’s possible.
Simulations:
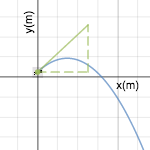
Here is a simulation for a projectile motion question we are going to work later this week. It shows the trajectory and velocity vectors (and components) for a dog jumping. You can just hit the play button to watch, or you can change the parameters by opening the “parameter” folder. For example, in class, we are going to vary the angle. @Desmos on twitter showed me that I could add a picture (hence the dog).
Dynamic Problem Representations:
Here is a problem a student was working on from our text: You can adjust the parameters to change the problem, or even shade the area under the curve, and adjust your guess for the final time.

Manual Curve Fitting for Labs:
Below is a draft of what a free-fall lab might look like in desmos. One thing you can do is use sliders to manually “fit”, which is pretty cool. But you can also have desmos find fits.

Activity Builder:
I’ve also more recently played around with their activity builder, which is pretty cool. In the activity builder you can create dynamic “worksheets” for students to work through, where you can ask questions, present texts, or give them graph/math to work with. Students access your worksheet at student.desmos.com and type in a code that is associated with your activity.
The really cool thing about the activity builder is from the teacher side: you get real-time visuals of student work. You can look at thumbprints of students graph or answers to check progress and compare, or you can enter into an individual students screen to look more closely. When students answer questions, you can also choose to have other students’ answer come up (or not).
But the really, really interesting thing is the “overlay” function, where you can take ALL the students’ graphs and overlay them on top of each other. You can project the overlay to students.
Below I built a draft of a desmos activity where students could enter in data and then graph acceleration vs. force. Each group would have a different mass, so the slopes of their lines would vary. Since I can show an overlay of all students’ graph, I can project this back to the class. The activity file has questions students answers about their own graph as well as the overlay of graphs, which others groups can see as they get answers.

(https://teacher.desmos.com/activitybuilder/custom/55f6be3044155e584187c169)
I think this setup is pretty awesome–making collaborative lab experiences more meaningful by making formative assessment easier, increasing student-student interactions about the content, making comparisons real-time and easy.
So far, I’m pretty excited to continue working with desmos, both to see what I can do with it and to see in what ways it might be a useful technology in my classrooms.

Leave a comment